
Alicia's Graph: Visualizing Continuity of a Linear Function
Loading the math board and drawing, please wait…
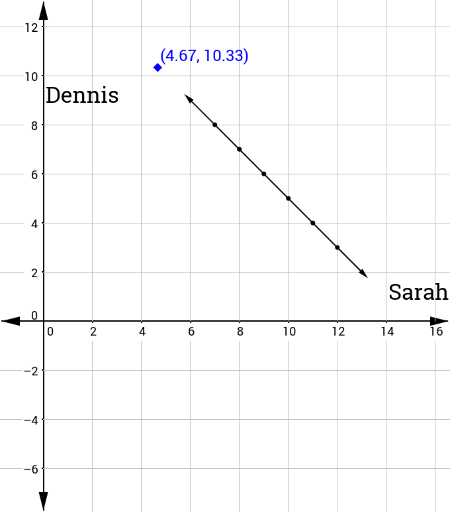
① This example dynamically illustrates the continuity of a linear function over the real numbers, showing that its graph is an unbroken straight line with no gaps or jumps. ② Core mathematical concepts include continuity, linear functions (first-degree functions), and the relationship between points and lines. ③ Construction highlights: using GeoGebra commands Line to draw straight lines, CLine for parallel or perpendicular lines, Point to mark key points (A, B, C, D, E, F), and text1/text2 for labels; objects include lines f, u, v, g and point G, allowing users to drag points and observe how function values change continuously with the independent variable. ④ Suitable for middle school (upper grades) and high school introductory lessons on functions and continuity, as well as a visual precursor to calculus concepts in pre-university courses, or as an extension for random experiments and geometric transformations.
GeoGebra Commands & Parameters
Line(F, A) → fCLine(F, A) → u, v, gPoint(f) → G
AI Drawing Prompt Reference
Draw a straight line to illustrate the continuity of a linear function, showing its graph as an unbroken line over real numbers. Include three parallel lines, a point moving along the line, and mark key points and lines. Observe how function values change continuously with the independent variable by dragging the point, suitable for teaching functions and continuity.
The prompt above was compiled from the original drawing commands and is for reference only.