
Adding Fractions with Tape Diagrams
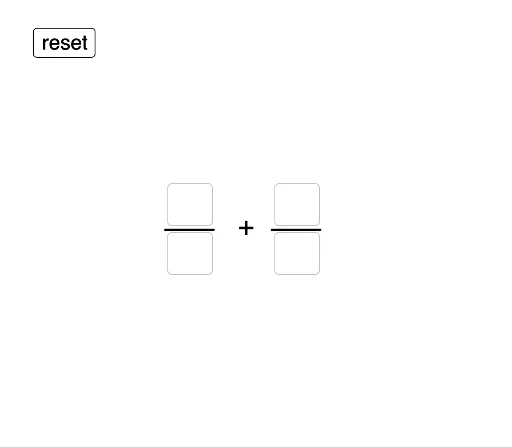
Loading the math board and drawing, please wait…
This example visually demonstrates the algorithm for adding fractions using tape diagrams. It covers core concepts like fraction addition, visual representation with tape diagrams, and the use of the greatest common divisor (GCD). Constructed with GeoGebra commands such as Textfield, Polygon, Sequence, and GCD, it is ideal for middle school mathematics education to enhance understanding of fraction addition through visualization.
GeoGebra Commands & Parameters
Textfield(inputNum1) → a1InputBoxNum1Textfield(inputDenom1) → a2InputBoxDenom1Textfield(inputNum2) → a3InputBoxNum2Textfield(inputDenom2) → a4InputBoxDenom2Polygon(B, B + (tapelength, 0), B + (tapelength, tapeheight), B + (0, tapeheight)) → Tape1, b, f, g, hPolygon(C, C + (tapelength, 0), C + (tapelength, tapeheight), C + (0, tapeheight)) → Tape2, c, i, j, kSequence(Segment[B + ((i * tape1unitlength), 0), B + ((i * tape1unitlength), tapeheight)], i, 1, inputDenom1 - 1) → tape1barsSequence(Segment[C + ((i * tape2unitlength), 0), C + ((i * tape2unitlength), tapeheight)], i, 1, inputDenom2 - 1) → tape2barsSequence(Segment[B + ((i * newunit1), 0), B + ((i * newunit1), tapeheight)], i, 1, (inputDenom1 * scale1) - 1) → newtape1barsSequence(Segment[C + ((i * newunit2), 0), C + ((i * newunit2), tapeheight)], i, 1, (inputDenom2 * scale2) - 1) → newtape2barsPolygon(B, B + ((tape1unitlength * inputNum1), 0), B + ((tape1unitlength * inputNum1), tapeheight), B + (0, tapeheight)) → FractionTape1, b_1, l, m, nPolygon(C, C + ((tape2unitlength * inputNum2), 0), C + ((tape2unitlength * inputNum2), tapeheight), C + (0, tapeheight)) → FractionTape2, c_1, p, q, rTextfield(inputnewnum1) → a5InputBoxNewNum1Textfield(inputnewdenom1) → a6InputBoxNewDenom1Textfield(inputnewnum2) → a7InputBoxNewNum2Textfield(inputnewdenom2) → a8InputBoxNewDenom2GCD(sumnum, sumdenom) → reduceby
AI Drawing Prompt Reference
Create a visual representation of fraction addition using tape diagrams. Show two tape diagrams in different colors, each representing a fraction with its numerator and denominator labeled. Then, add the two fractions and display the result with a new tape diagram, also labeled with its numerator and denominator. Finally, show the simplified fraction as the sum of the two fractions, illustrating the calculation process and the use of tape diagrams for fraction addition.
The prompt above was compiled from the original drawing commands and is for reference only.