
Add to Multiply Interactive Demo
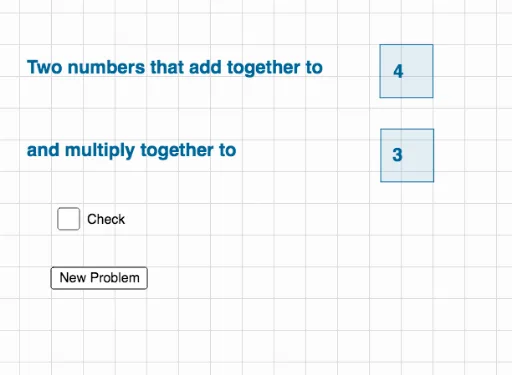
Loading the math board and drawing, please wait…
This example demonstrates the relationship between addition and multiplication in geometric area calculations through interactive graphics. It involves core math concepts like probability distribution, rectangle area, real number operations, and linear regression. Construction highlights include using commands like Random and Polygon, along with objects such as sliders a, b, c, d for dynamic visualization. Suitable for high school mathematics teaching, focusing on the application of probability and geometry integration.
GeoGebra Commands & Parameters
Random(-10, 10) → aRandom(-10, 10) → bPolygon(A, B, C, D) → poly1, a_1, b_1, c_1, d_1Polygon(E, F, G, H) → poly2, e_1, f, g, h
AI Drawing Prompt Reference
Create an interactive geometry demo illustrating the relationship between addition and multiplication through area calculations. Draw two rectangles: the first has vertices randomly placed within a coordinate range from -10 to 10, and the second is formed by another set of four points, positioned near or overlapping the first. Fill each rectangle with a semi-transparent color and display its area value. Below the rectangles, place four sliders that control the width and height of each rectangle. As the sliders are dragged, the rectangles resize in real time, and the sum and product of the two areas are shown numerically, making the geometric meaning of addition and multiplication clear. The layout should be clean and suitable for high school classroom use.
The prompt above was compiled from the original drawing commands and is for reference only.