
Add Fractions with Area Models
Loading the math board and drawing, please wait…
In collections
Primary School Mathematics Collection
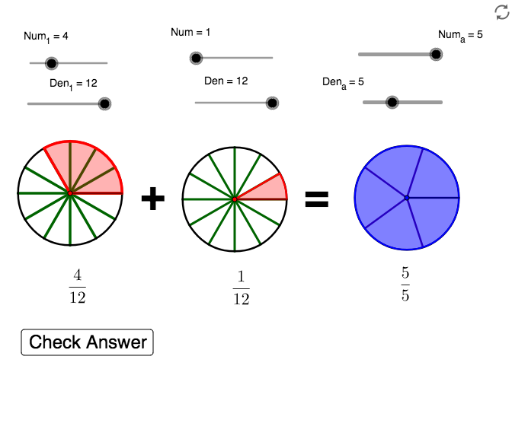
This example uses area models to help students practice adding fractions. It involves the core mathematical concept of fraction addition. Using GeoGebra commands such as Circle, Point, Segment, Append, CircleSector, Zip, and LCM, students can visually understand the process of fraction addition. Suitable for high-grade elementary or junior high school students.
GeoGebra Commands & Parameters
Circle(A, 1) → cPoint(c) → BSegment(A, B) → aAppend(Sequence[Rotate[B, i, A], i, (360 / Den_1)°, 359.9°, (360 / Den_1)°], Rotate[B, 359.99°, A]) → ListPCircleSector(A, B, Element[ListP, Num_1]) → ShadeCircle(C, 1) → dPoint(d) → DAppend(Sequence[Rotate[D, s, C], s, (360 / Den)°, 359.9°, (360 / Den)°], Rotate[D, 359.99°, C]) → ListP2CircleSector(C, D, Element[ListP2, Num]) → Shade2Segment(C, D) → bZip(Segment[C, W], W, ListP2) → ListS2Zip(Segment[A, Z], Z, ListP) → ListSCircle(E, 1) → ePoint(e) → FSegment(E, F) → fAppend(Sequence[Rotate[F, s, E], s, (360 / Den_a)°, 359.9°, (360 / Den_a)°], Rotate[F, 359.99°, E]) → list1CircleSector(E, F, Element[list1, Num_a]) → Shade3Zip(Segment[E, k], k, list1) → list2LCM(Den_1, Den) → g
AI Drawing Prompt Reference
Create an area model to demonstrate the addition of fractions by drawing a circle and marking its center and circumference points, then rotate and segment to form multiple sectors representing different fractions, connect key points with lines, and combine the sectors to visually show the result of fraction addition, suitable for educational purposes.
The prompt above was compiled from the original drawing commands and is for reference only.