
Accumulation of Area Under Linear Functions
Loading the math board and drawing, please wait…
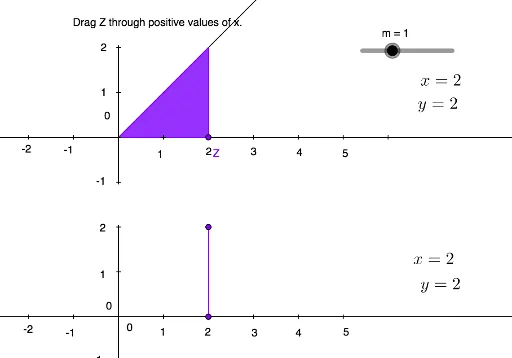
This GeoGebra example dynamically illustrates the accumulation of area under a linear function, demonstrating the geometric meaning of the definite integral as an area-accumulation function. Core mathematical concepts include definite integrals, indefinite integrals, area accumulation, and comparisons between linear functions and other curves such as sine and parabolas. Construction highlights: using GeoGebra commands such as Point, Line, OrthogonalLine, Intersect, Circle, Ray, Polygon, and Segment to build points, lines, perpendiculars, intersections, circles, rays, polygons, and segments, with sliders or dynamic points controlling the changing interval to observe how the accumulated area grows with the independent variable. Suitable for high school to early college students learning the relationship between integration and area, and for teachers as a visual demonstration tool to bridge discrete summation and continuous integration.
GeoGebra Commands & Parameters
Point(yAxis) → APoint(yAxis) → BPoint(yAxis) → CPoint(xAxis) → DPoint(xAxis) → EPoint(xAxis) → FPoint(xAxis) → GPoint(xAxis) → HPoint(xAxis) → IPoint(yAxis) → KPoint(yAxis) → LPoint(yAxis) → MLine(M, xAxis) → aOrthogonalLine(M, a) → bLine(E, J) → cPoint(b) → NPoint(b) → OPoint(a) → PPoint(a) → QPoint(a) → RPoint(a) → SPoint(a) → TPoint(a) → UPoint(a) → VPoint(a) → WLine(B, K) → dLine(A, O) → ePoint(a) → ZOrthogonalLine(Z, c) → fIntersect(c, f) → A_1Circle(Z, (m * x(Z))) → gIntersect(g, f) → B_1, C_1Ray(M, C_1) → hPolygon(M, Z, C_1) → poly1, c_1, m_1, zCircle(A_1, ((m * x(B)) * x(b) / 2)) → kCircle(A_1, ((m * x(Z)) * x(Z) / 2)) → pIntersect(p, f) → D_1, E_1Segment(E_1, A_1) → iSegment(B, K) → jSegment(A, O) → l
AI Drawing Prompt Reference
On a coordinate plane, place several points on the vertical and horizontal axes. Draw a horizontal line through a point on the horizontal axisaine, and from a point on the vertical axis construct a perpendicular to this line. Connect a point on the horizontal axis to a point on the vertical axis with a slanted line. Pick multiple points on the horizontal line, and from one of them drop a perpendicular to the slanted line, meeting it at an intersection. Using this intersection as center, draw a circle whose radius equals a linear function of the x-coordinate, intersecting the perpendicular. From the vertical-axis point, draw a ray to this intersection, and together with the horizontal-line point and the intersection form a triangle. Then, centered at the slanted-line intersection, draw two circles with radii equal to the linear function value and half the square of the x-coordinate respectively. Take the intersection of one circle with the perpendicular, connect it to the center with a segment, and also connect relevant vertical-axis points with two segments, illustrating how the accumulated area grows with the x-coordinate.
The prompt above was compiled from the original drawing commands and is for reference only.