
Distance Accumulation with Constant Velocity
Loading the math board and drawing, please wait…
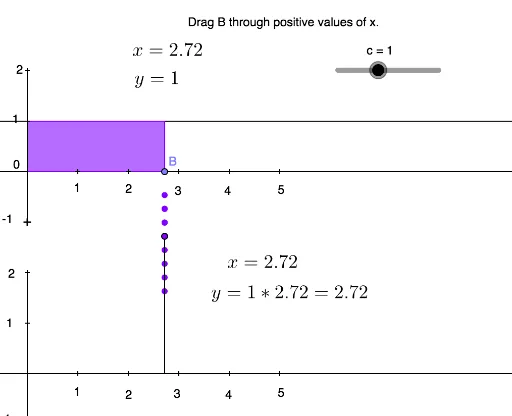
This example demonstrates the graphical phenomenon of distance accumulation over time under constant velocity. It involves core calculus concepts like definite and indefinite integrals, and area accumulation. Constructed using GeoGebra commands/objects such as Point, Line, OrthogonalLine, Distance, Circle, Intersect, Segment, Polygon. Suitable for high school and above students learning calculus and physics kinematics.
GeoGebra Commands & Parameters
Point(yAxis) → ALine(A, xAxis) → aOrthogonalLine(A, xAxis) → bPoint(a) → BDistance(A, B) → distanceABCircle(A, c) → dIntersect(b, yAxis) → CIntersect(b, yAxis) → DIntersect(b, yAxis) → EIntersect(b, yAxis) → FIntersect(b, yAxis) → GIntersect(d, yAxis) → H, ILine(I, a) → eOrthogonalLine(B, e) → fIntersect(e, f) → JSegment(J, B) → gPolygon(A, I, J, B) → poly1, a_1, i, j, b_1OrthogonalLine(B, xAxis) → hIntersect(h, xAxis) → KCircle(K, (c * distanceAB)) → kIntersect(k, h) → L, MSegment(M, K) → lIntersect(xAxis, yAxis) → NSegment(N, M) → mLine(N, a) → nPoint(b) → OPoint(b) → PPoint(b) → QSegment(Q, O) → pPoint(n) → RPoint(n) → SPoint(n) → TPoint(n) → UPoint(n) → VPoint(n) → WPoint(a) → ZPoint(b_1) → B_1Point(a) → C_1Point(a) → D_1Point(a) → E_1Point(a) → F_1Point(b) → H_1Point(b) → I_1Point(b) → J_1Segment(J_1, H_1) → qPoint(a) → K_1
AI Drawing Prompt Reference
On a coordinate plane, start with a point on the vertical axis. Draw a horizontal line through it and a perpendicular vertical line. Pick a point on the horizontal line, measure the distance from the start point, and draw a circle centered at the start point with that radius. The circle intersects the vertical axis at two points; choose one, draw a horizontal line through it, and intersect with the previous vertical line to get a point. Connect this point to the point on the horizontal line, forming a segment, and construct a quadrilateral with the start point and the chosen intersection. Then, from the point on the horizontal line, drop a perpendicular to the horizontal axis, mark the foot, and draw a circle centered there with radius equal to the product of the original distance and the radius. This circle meets the perpendicular at two points; take one and connect it to the center. Finally, place several points on the axes and lines, and connect some of them with segments to illustrate the accumulation of distance over time.
The prompt above was compiled from the original drawing commands and is for reference only.