
A9 Mathematics Example
Loading the math board and drawing, please wait…
In collections
Locus Line Equations demos
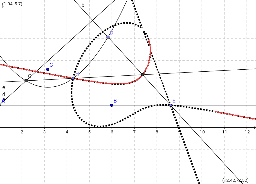
This example demonstrates how to use GeoGebra to draw lines, parabolas, points, orthogonal lines, intersections, loci, and locus equations. It involves core mathematical concepts such as coordinate geometry, standard deviation, statistics, and probability. Key construction steps include using commands and objects like Line, Parabola, Point, OrthogonalLine, Intersect, Locus, and LocusEquation. Suitable for high school and above, aiding in geometric construction and data analysis understanding.
GeoGebra Commands & Parameters
Line(A, B) → aParabola(C, a) → cPoint(c) → DPoint(a) → ELine(D, E) → bOrthogonalLine(A, b) → dIntersect(c, d, 1) → GPoint(c) → HLine(G, H) → eIntersect(b, e) → ILocus(I, D) → loc1LocusEquation(I, D) → f
AI Drawing Prompt Reference
Draw a line and a parabola, take a point on the line, then draw a tangent line to the parabola through this point, find the intersection of the tangent line with the parabola, draw a normal line to the parabola at this intersection, find the other intersection of the normal line with the parabola, connect the point on the parabola to this intersection, draw a line connecting the endpoints of the initial line, then draw a perpendicular line to this connecting line through the point on the parabola, find their intersection, and finally plot the locus of this intersection point along with the point on the parabola and its equation.
The prompt above was compiled from the original drawing commands and is for reference only.