
A1.AREI.11 - Solve an Equation Graphically
Loading the math board and drawing, please wait…
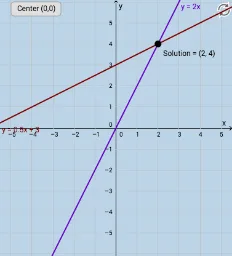
This GeoGebra applet demonstrates solving systems of linear equations graphically. Students can first solve by hand and then quickly check their work using the interactive tool. The core mathematical concept is the intersection of two linear functions, where the coordinates of the intersection point represent the solution to the system. The construction uses the Intersect command to find the crossing point, FractionText to display exact fractional solutions, Textfield and InputBox for user input, Point to mark the solution, and a button to trigger verification. Suitable for middle school to high school students learning linear equations, graphing, and intersection concepts, as well as for teachers demonstrating in class or for independent practice.
GeoGebra Commands & Parameters
Intersect(g, i) → SolutionFractionText(x(Solution)) → text1FractionText(y(Solution)) → text2Textfield(g) → InputBox1Textfield(i) → InputBox2Intersect(i, xAxis) → APoint(i) → BPoint(g) → CPoint(g) → D
AI Drawing Prompt Reference
Draw two lines l1 and l2 with equations y=2x+1 and y=-x+4 respectively. Find the intersection point of these two lines, display the coordinates of the intersection point, and mark the intersection point with a point.
The prompt above was compiled from the original drawing commands and is for reference only.