
Revenue, Cost, and Profit: Introduction
Loading the math board and drawing, please wait…
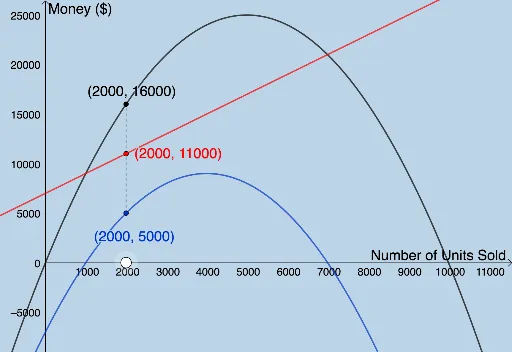
This example demonstrates the relationship between revenue, cost, and profit. Using functions, quadratic functions, and exponential functions, it illustrates how to understand these economic concepts through the construction of trajectories in coordinate geometry. Commands like Intersect and Segment are used, suitable for high school mathematics education.
GeoGebra Commands & Parameters
Intersect(P, f, 1) → EIntersect(C, f, 1) → FIntersect(R, f, 1) → GSegment(E, F) → gSegment(F, G) → h
AI Drawing Prompt Reference
Draw a function curve in a coordinate system, and from a point on the curve, draw perpendicular lines to the x-axis and y-axis to get two intersection points. Then connect these two intersection points and the other intersection point on the x-axis, forming three line segments to illustrate the relationship between revenue, cost, and profit.
The prompt above was compiled from the original drawing commands and is for reference only.