
3D and Axis Graphs
Loading the math board and drawing, please wait…
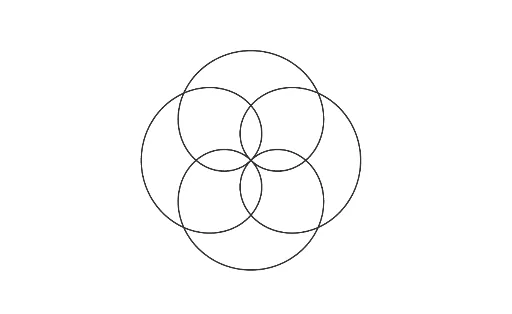
This example demonstrates how to plot curves in 3D space and visualize their relationship with coordinate axes. Key math concepts include 3D coordinate systems, curve equations, and parametric equations. It uses the GeoGebra 'CurveCartesian' command with parameters a, b, c, d. Suitable for high school and above students learning 3D geometry, function graphs, and parametric equations, or for educational purposes.
GeoGebra Commands & Parameters
CurveCartesian((sin((a * t)), cos((b * t))), t, 0, (2 * 3.141592653589793)) → cCurveCartesian((cos((a / b * θ)); θ), θ, 0, (20 * π)) → d
AI Drawing Prompt Reference
Plot a 3D curve defined by the parametric equations sin(at) and cos(bt), where a and b are constants. Then plot another 3D curve defined by the parametric equation cos(a/b * θ), where a and b are constants and θ is the parameter. Observe the relationship between these curves and the coordinate axes to understand 3D coordinate systems and curve equations.
The prompt above was compiled from the original drawing commands and is for reference only.