
2D Vector & Function Graph Interaction Example
Loading the math board and drawing, please wait…
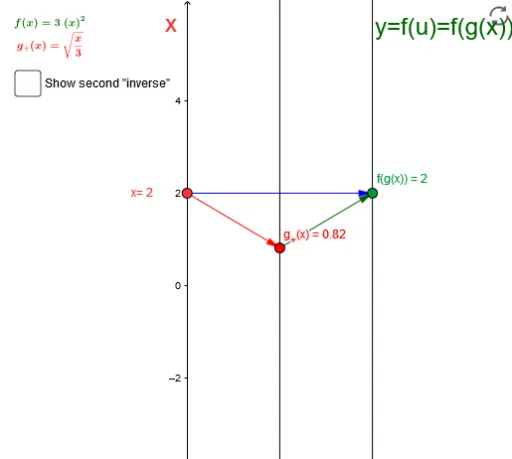
This example demonstrates the interaction between 2D vectors and function graphs by dynamically adjusting vector parameters to observe their effects on the function images. Core math concepts include vector operations, function graph plotting, and ellipse and boxplot visualization. Construction highlights the use of GeoGebra commands like Point, Vector, and Textfield, combined with slider animations and locus tracking, making it suitable for high school students learning analytical geometry and function graphs.
GeoGebra Commands & Parameters
Point(yAxis) → A_1Vector(A_1, B_1) → uVector(B_1, C_1) → vTextfield(g_+) → inputBox1Textfield(f) → inputBoxfVector(A_1, C_1) → wPoint(g_+) → DVector(A_1, B_2) → dVector(B_2, C_1) → e
AI Drawing Prompt Reference
Draw a 2D coordinate system with two vectors u and v starting from a point A on the y-axis and pointing to B1 and C1 respectively. Vector w goes from A to C1. Use input fields to adjust the length and direction of vectors u and v to observe their effects on the function graph. Plot a function graph, with input field f for entering the function expression.
The prompt above was compiled from the original drawing commands and is for reference only.