
2020 Inequality Learning Example
Loading the math board and drawing, please wait…
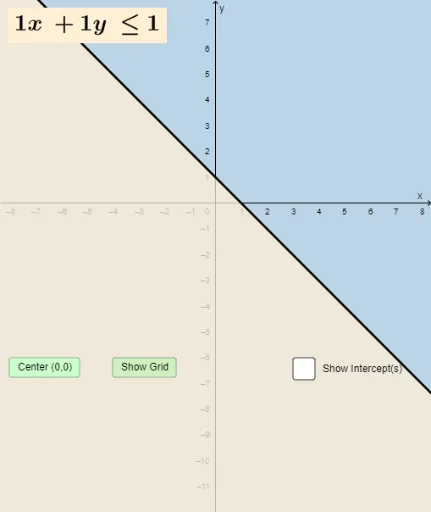
This example demonstrates dynamic relationships between inequalities, vectors, and planes in 2D space; core math concepts include inequality representation, vector operations, plane equations, scatter plots, and median values; constructed using GeoGebra commands like Textfield, Intersect, Slope, Slider, and Locus for interactive graphing; suitable for high school and above mathematics education, focusing on geometric interpretations and parametric analysis of inequalities.
GeoGebra Commands & Parameters
Textfield(a) → InputBox1Textfield(b) → InputBox2Textfield(c) → InputBox3Intersect(f, y = 0) → AIntersect(f, x = 0) → BSlope(f) → m
AI Drawing Prompt Reference
Draw a function curve in 2D space with adjustable parameters, showing its intersection points with the coordinate axes and the slope of the curve. Use input boxes to set parameters, and illustrate regions represented by inequalities with the intersection points. Display vectors and planes to show their relationships. Add sliders for dynamic changes, and plot scatter plots highlighting median values. Suitable for high school and above education to understand dynamic relationships between inequalities, vectors, and coordinate geometry, focusing on geometric interpretations and parametric analysis.
The prompt above was compiled from the original drawing commands and is for reference only.