
Sele 2012 - 72: Vector, Statistics, Probability, and Pythagorean Geometry
Loading the math board and drawing, please wait…
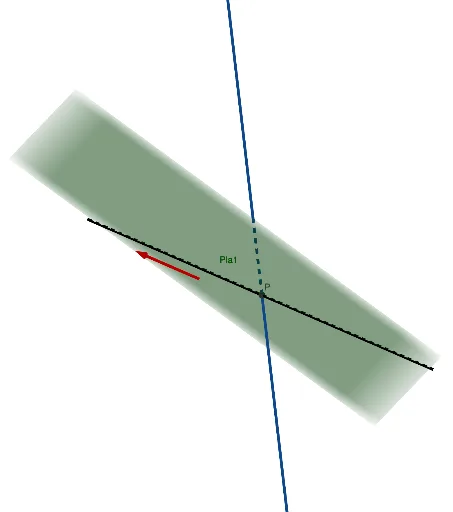
This GeoGebra example demonstrates a comprehensive mathematical problem from Sele 2012, item 72, integrating vectors, bar chart statistics, probability, interest calculation, and the Pythagorean theorem. The core concepts involve vector operations and geometric representation, statistical data visualization via bar graphs, probability computation, interest models (simple or compound), and the Pythagorean relationship in right triangles. The construction uses GeoGebra commands such as IntersectPath, Intersect, and Line, with objects including three planes (Pla1, Pla2, Pla3), a line r, a point P, a variable n, direction vectors dr and ds, and a line s, to create intersections and paths that illustrate the geometric relationships. This example is suitable for high school or pre-university students for cross-topic review, and for teachers designing inquiry-based exercises to show connections between different mathematical branches.
GeoGebra Commands & Parameters
IntersectPath(Pla2, Pla3) → rIntersect(Pla1, r) → PLine((x(P), y(P), z(P)), Vector[(x(ds), y(ds), z(ds))]) → s