
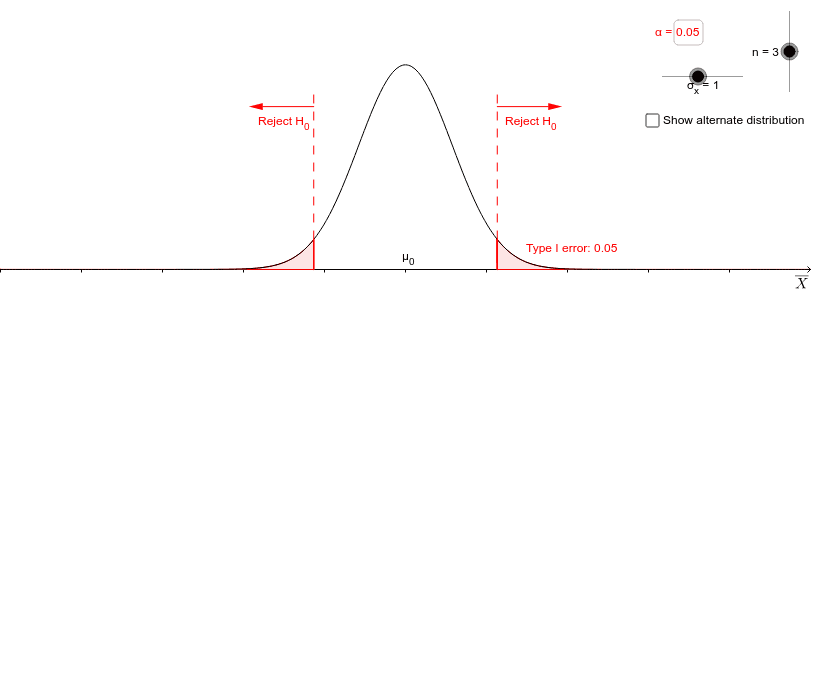
假设检验的功效可视化
几何画板及绘图内容加载中,请稍等……
所属专题
AP Statistics
①本范例通过可视化展示统计功效的概念,并帮助说明功效、样本量、标准差之间的关系;②涉及的核心数学概念包括假设检验、统计功效、样本量、标准差、正态分布;③作图要点——从下方『构造摘要』提炼用到了 Point, InverseNormal, Normal, Segment, IntegralBetween, Textfield, Vector 等GeoGebra命令/对象;④适合高中及以上学生或统计学初学者学习假设检验与统计功效。
GeoGebra 命令及参数
Point(baseline) → mu1PointInverseNormal(mu0, sigma0, 1 - alpha / 2) → nullRightThresholdInverseNormal(mu0, sigma0, alpha / 2) → nullLeftThresholdNormal(mu0, sigma0, x) → nullDistSegment((nullLeftThreshold, nullDist(nullLeftThreshold)), (nullLeftThreshold, 0)) → leftThresholdLineSegment((nullRightThreshold, nullDist(nullRightThreshold)), (nullRightThreshold, 0)) → rightThresholdLineIntegralBetween(f, baseline, nullLeftThreshold, nullRightThreshold) → T2RegionIntegralBetween(f, baseline, Min[leftBound, mu1 - (4 * sigma1)], nullLeftThreshold) → leftPowerRegionIntegralBetween(f, baseline, nullRightThreshold, Max[rightBound, mu1 + (4 * sigma1)]) → rightPowerRegionTextfield(alpha) → alphaInputBoxIntegralBetween(nullDist, 0, leftBound, nullLeftThreshold) → t1lefttailIntegralBetween(nullDist, 0, nullRightThreshold, rightBound) → t1righttailSegment((nullLeftThreshold, nullDist(nullLeftThreshold)), (nullLeftThreshold, 0.6)) → leftRejectLineSegment((nullRightThreshold, nullDist(nullRightThreshold)), (nullRightThreshold, 0.6)) → rightRejectLineVector((nullLeftThreshold, 0.55), (nullLeftThreshold - 0.8, 0.55)) → leftRejectArrowVector((nullRightThreshold, 0.55), (nullRightThreshold + 0.8, 0.55)) → rightRejectArrowTextfield(difference) → differenceInputBoxSegment((nullLeftThreshold, 0), (nullLeftThreshold, offset)) → leftThresholdLine2Segment((nullRightThreshold, 0), (nullRightThreshold, offset)) → rightThresholdLine2Segment(Point[{mu0, offset - 0.09}], Point[{mu0, offset - 0.11}]) → differenceLineLeftEndSegment(Point[{mu1, offset - 0.09}], Point[{mu1, offset - 0.11}]) → differenceLineRightEndSegment(Point[{mu0, offset}], Point[{mu0, offset - 0.017}]) → altOriginMarkSegment((mu0, 0), (mu0, offset)) → mu0GuidelineVector((mu0, offset - 0.1), (mu1, offset - 0.1)) → differenceLine
AI 绘图提示语参考
画一个展示假设检验统计功效的图形,包含两条水平线表示临界值,一个正态分布曲线,以及两个积分区域表示第一类错误和第二类错误。使用滑块调节标准差和样本量,显示不同参数下的功效变化。添加箭头和文本标注说明关键区域和参数。
以上提示语为根据原始绘图命令整理而来,仅供参考。