
可视化偏导数 by Andrew Cooper
几何画板及绘图内容加载中,请稍等……
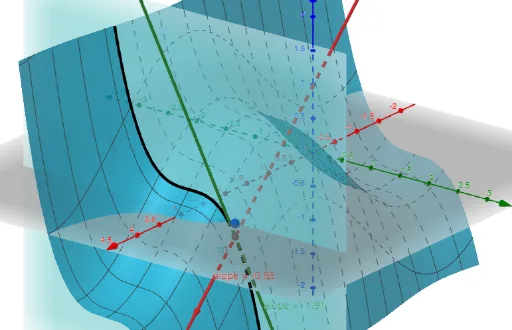
这个范例通过动态图形展示了偏导数的概念。它涉及多元函数的偏导数,通过构造切线和切平面来直观理解偏导数的意义。使用了PointIn, Derivative, IntersectPath, Line, Vector等GeoGebra命令。适合大学微积分课程使用。
GeoGebra 命令及参数
PointIn(z = 0) → ADerivative(f, x) → FxDerivative(f, y) → FyIntersectPath(p, f) → eq1IntersectPath(q, f) → eq2Line(B, Vector[(1, 0, Fx(x(A), y(A)))]) → gLine(B, Vector[(0, 1, Fy(x(A), y(A)))]) → hVector(B, B + (1, 0, Fx(x(A), y(A)))) → aVector(B, B + (0, 1, Fy(x(A), y(A)))) → b