
导数测试原理与作图方法
几何画板及绘图内容加载中,请稍等……
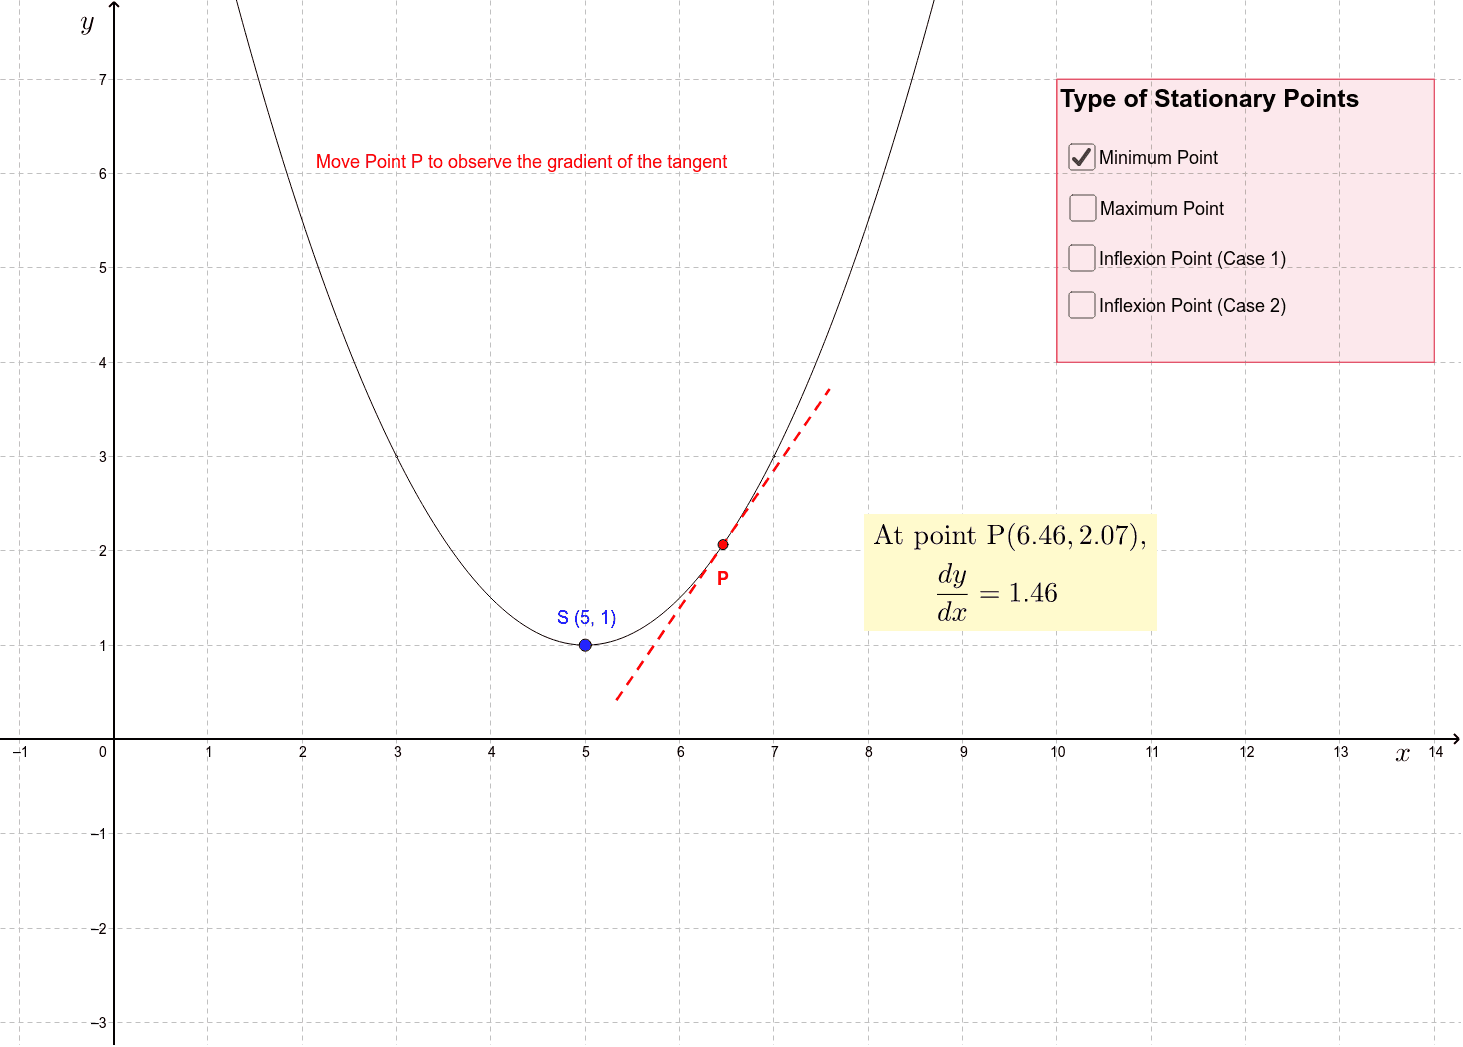
本范例演示了如何通过导数判断函数的极值点与单调性。核心数学概念包括导数、极值、切线等。作图要点涉及使用GeoGebra命令如Point、Tangent、Circle等来构造函数图像、切线及交点。适合高中生或大学低年级学生用于学习微积分基础。
GeoGebra 命令及参数
Point(f) → MinPTangent(MinP, f) → MinLinePoint(g) → MaxPTangent(MaxP, g) → MaxLinePoint(h) → PositiveInflexionPTangent(PositiveInflexionP, h) → PositiveInflexionLinePoint(p) → NegativeInflexionPTangent(NegativeInflexionP, p) → NegativeInflexionLineCircle(MinP, 2) → MinCircleIntersect(MinCircle, MinLine) → MinIntersectA, MinIntersectBSegment(MinIntersectA, MinIntersectB) → MinTangentCircle(MaxP, 2) → MaxCircleIntersect(MaxCircle, MaxLine) → MaxIntersectA, MaxIntersectBSegment(MaxIntersectB, MaxIntersectA) → MaxTangentCircle(PositiveInflexionP, 2) → PositiveInflexionCircleIntersect(PositiveInflexionCircle, PositiveInflexionLine) → PositiveInflexionIntersectA, PositiveInflexionIntersectBSegment(PositiveInflexionIntersectA, PositiveInflexionIntersectB) → PositiveInflexionTangentCircle(NegativeInflexionP, 2) → NegativeInflexionCircleIntersect(NegativeInflexionCircle, NegativeInflexionLine) → NegativeInflexionIntersectA, NegativeInflexionIntersectBSegment(NegativeInflexionIntersectA, NegativeInflexionIntersectB) → NegativeInflexionTangentPolygon(A, B, C, D) → poly1, a, b, c, d
AI 绘图提示语参考
这个图形展示了导数第一导数测试中的关键点及其切线。图形包括最小值点、最大值点、正导数拐点和负导数拐点,以及对应的切线。构造顺序是先确定这些点,然后绘制切线,再以这些点为圆心画半径为2的圆,将圆与切线相交得到交点,最后连接这些交点形成切线。图形整体呈现导数与极值、拐点的关系,适合学习者理解导数概念。
以上提示语为根据原始绘图命令整理而来,仅供参考。