
指数函数变换 by cemccourseware (2)
几何画板及绘图内容加载中,请稍等……
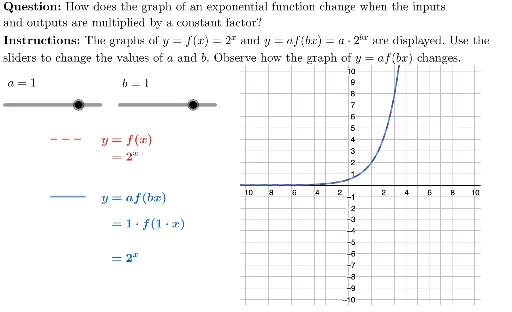
①本范例演示指数函数图像的平移变换;②涉及核心数学概念:指数函数的性质、图像变换规则;③作图要点:使用 GeoGebra 命令 Polygon, Element, NumToImproperFrac, LaTeX, Segment 构造函数图像和变换过程;④适合高中数学教学,用于理解指数函数图像变换规律。
GeoGebra 命令及参数
Polygon((-10.5, -10.5), (-10.5, 10.5), (10.5, 10.5), (10.5, -10.5)) → viewBox, f, g, h, iElement(potentialVariableValues, b) → bValueElement(potentialVariableValues, a) → aValueNumToImproperFrac(aValue) → aValueDispNumToImproperFrac(bValue) → bValueDispLaTeX((((If[aValue ≟ 1, "", If[aValue ≟ -1, "-", (aValueDisp * "\cdot")]] * "2^{") * If[bValue ≟ 1, "", If[bValue ≟ -1, "-", bValueDisp]]) * "x}")) → imageFunctionTxtLaTeX("\text{\textbf{Question: }How does the graph of an exponential function change when the inputs\\and outputs are multiplied by a constant factor?\\\textbf{Instructions: }The graphs of \(y=f(x)=2^x\) and \(y=af(bx)=a\cdot2^{bx}\) are displayed. Use the\\sliders to change the values of \(a\) and \(b\). Observe how the graph of \(y=af(bx)\) changes.}") → TEXTSegment(LegendAnchor, LegendAnchor + (3, 0)) → fxLegendSegment(LegendAnchor + (0, -5), LegendAnchor + (3, -5)) → afxLegend