
时间序列分析问题
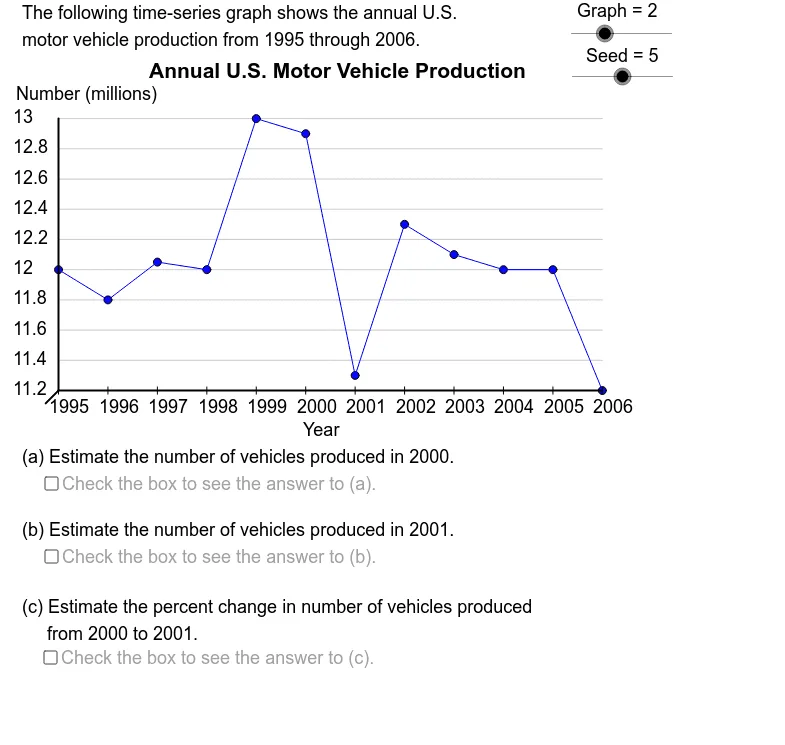
几何画板及绘图内容加载中,请稍等……
所属专题
Charts & Graphs
①本范例演示了多种时间序列图形,要求学生估算给定时间段之间的百分比变化;②涉及的核心数学概念包括统计、直线、指数函数、随机变量;③作图要点:使用了 GeoGebra 命令 Element, CountIf, Max, Min, If, Sequence, Segment, Text,对象包括 GrBt, GrLf, DtY19, DtY18, DtY60, DtY17, DtYSq, Graph, DtY, Size, GrRt, GrTp, size, XScl, YDtMx, YDtMn, RngY, UBSY, LBSY, YScl, YAxMn, YAxMx, VSlp, AdpY, OpSq, Seed, Opt, Val2, Val1, PrpCh, DtX17, DtX18, DtX60, DtX19, DtXSq, DtX, YScSq, XScSq, llsg, GrBR;④适合高中及以上数学学习者和研究者使用。
GeoGebra 命令及参数
Element(DtYSq, Graph) → DtYCountIf(x ≠ (0, 0), DtY) → SizeMax(DtY) → YDtMxMin(DtY) → YDtMnIf((5 * LBSY) ≤ UBSY, (5 * LBSY), If[(2 * LBSY) ≤ UBSY, (2 * LBSY), LBSY]) → YSclSequence(Mod[2 + (5 * k), Size - 1] + 1, k, 1, Size - 1) → OpSqElement(OpSq, Seed) → OptElement(DtY, Opt + 1) → Val2Element(DtY, Opt) → Val1Element(DtXSq, Graph) → DtXSegment((-1.414, -1.414), (0, 0)) → llsgSegment(GrBL, GrBR) → haxSegment(GrBL, GrTL) → vaxSequence((((k - 1) * XScl), AdpY(Element[DtY, k])), k, 1, Size) → PtSqElement(VTtSq, Graph) → VL2Element(DDSq, Graph) → DDElement(TtSq, Graph) → TitleElement(DtX, Opt) → Time1Element(DtX, Opt + 1) → Time2Element(SbSq, Graph) → SubjectElement(UntSq, Graph) → UnitIf(Val1 < Val2, "increase", If[Val1 > Val2, "decrease", "change"]) → DirSequence(Segment[Element[PtSq, k - 1], Element[PtSq, k]], k, 2, Size) → SgSqSequence(Segment[((k * XScl), (-0.4)), ((k * XScl), 0.4)], k, 0, Size - 1) → XTcSqIf(Graph ≟ 4, "the ", "") → ArticleIf(Graph ≟ 1 ∧ ((Opt < 5) ∨ (Opt > 7)), "", ".") → Punc1If(Graph ≟ 1 ∧ ((Opt < 4) ∨ (Opt > 6)), "", ".") → Punc2Sequence(Segment[(0, AdpY(k)), (GrRt, AdpY(k))], k, YAxMn, YAxMx, YScl) → HGrdsSequence(Text[k, ((-5), AdpY(k) - 0.5)], k, YAxMn, YAxMx, YScl) → YLbSqSequence(Text[Element[DtX, k], (((k - 1) * XScl) - 1, (-2.5))], k, 1, Size) → XLbSqText(Element[HTtSq, Graph], (27, -5)) → HLb
AI 绘图提示语参考
绘制一个时间序列分析图表,展示数据点和变化趋势。图表包含X轴和Y轴,X轴标注时间,Y轴标注数值。根据数据点绘制折线,并用不同颜色或标记区分增加和减少的趋势。在图表下方添加标题和说明文字,标注数据来源和单位。
以上提示语为根据原始绘图命令整理而来,仅供参考。