
温度随时间变化模拟 by harrytomalley
几何画板及绘图内容加载中,请稍等……
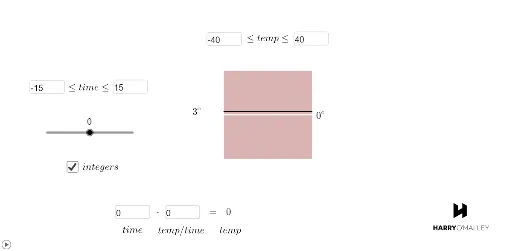
①本范例演示温度随时间变化的模拟过程,通过图形化展示数据趋势;②涉及核心数学概念包括函数图像、乘法运算、等边三角形、利率计算、最大公约数与最小公倍数、整数运算;③作图要点运用了Polygon(多边形)、Textfield(文本框)、Segment(线段)、If(条件判断)等GeoGebra命令与对象;④适合高中阶段数学教学,用于理解函数模拟与几何构造结合的应用。
GeoGebra 命令及参数
Polygon(A, B, 4) → poly1, f, g, h, i, C, DTextfield(cmin) → InputBox1Textfield(cmax) → InputBox2Textfield(a) → InputBox3Textfield(outputmin) → InputBox4Textfield(outputmax) → InputBox5Textfield(p) → InputBox6Segment(E, F) → jTextfield(a) → InputBox3_1Textfield(outputmin) → InputBox4_1Textfield(outputmax) → InputBox5_1Segment(E_1, F_1) → j_1Polygon(A_1, B_1, 4) → poly1_1, f_1, g_1, h_1, i_1, C_1, D_1Textfield(a) → InputBox3_2Textfield(outputmin) → InputBox4_2Textfield(outputmax) → InputBox5_2Textfield(a) → InputBox3_3Textfield(outputmin) → InputBox4_3Textfield(outputmax) → InputBox5_3Textfield(a) → InputBox3_4Textfield(outputmin) → InputBox4_4Textfield(outputmax) → InputBox5_4Textfield(a) → InputBox3_5Textfield(outputmin) → InputBox4_5Textfield(outputmax) → InputBox5_5Textfield(a) → InputBox3_6Textfield(outputmin) → InputBox4_6Textfield(outputmax) → InputBox5_6Textfield(a) → InputBox3_7Textfield(outputmin) → InputBox4_7Textfield(outputmax) → InputBox5_7If(ZeroToOne < 94 / 256, 255, 94 / 256 ≤ ZeroToOne ≤ 210 / 256, ((-2.198 * (ZeroTo256 - 210))) / 256, ZeroToOne > 210 / 256, 0) → blueIf(ZeroToOne < 37 / 256, 0, 37 / 256 ≤ ZeroToOne ≤ 179 / 256, (48.845 * (ZeroTo256 - 37)^(1 / 3) / 256), ZeroToOne > 179 / 256, 1) → redIf(ZeroToOneTwo < 94 / 256, 255, 94 / 256 ≤ ZeroToOneTwo ≤ 210 / 256, ((-2.198 * (ZeroTo256Two - 210))) / 256, ZeroToOneTwo > 210 / 256, 0) → blue2If(ZeroToOneTwo < 37 / 256, 0, 37 / 256 ≤ ZeroToOneTwo ≤ 179 / 256, (48.845 * (ZeroTo256Two - 37)^(1 / 3) / 256), ZeroToOneTwo > 179 / 256, 1) → red2Textfield(rate) → InputBox7Segment(E_2, F_2) → kSegment(E_2, H) → l
AI 绘图提示语参考
绘制一个温度随时间变化的模拟界面,包含多个输入框用于设置温度范围、变化速率等参数。界面中有一个正方形区域,内部通过分段函数生成红蓝渐变色带,表示温度高低。另有一条线段连接两个点,用于显示时间轴或温度曲线。整体布局包含多个重复的输入框和线段,形成参数控制面板与可视化区域的组合,强调函数图像与几何构造的结合。
以上提示语为根据原始绘图命令整理而来,仅供参考。