
足球比赛进球数的均值与中位数
几何画板及绘图内容加载中,请稍等……
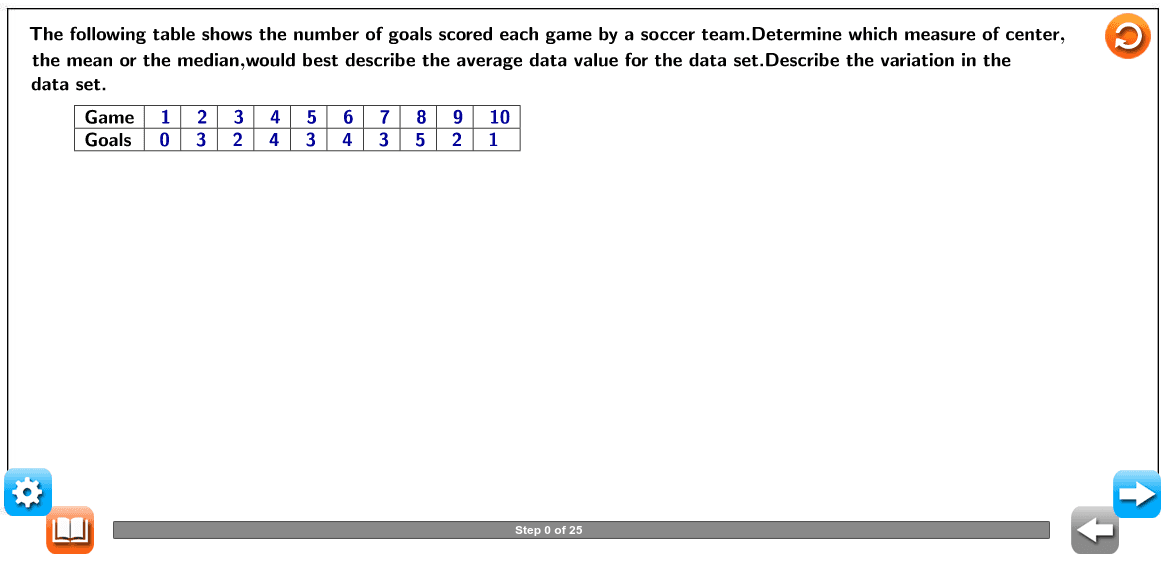
①本范例演示了如何通过GeoGebra绘制足球团队每场比赛进球数的直方图和箱线图;②涉及的核心数学概念包括均值、中位数、概率统计;③作图要点提炼自构造摘要,使用了LaTeX、Polygon、Sort、Element、Segment、Sequence、DotPlot、Sum、Median、Mean、TableText、BoxPlot等命令和对象;④适合高中阶段学习概率统计和数据分析的学生使用。
GeoGebra 命令及参数
LaTeX((("\text{" * val3) * "}")) → Equaliservalue2LaTeX((("\text{" * val4) * "}")) → Equaliservalue3LaTeX((("\text{" * val5) * "}")) → Equaliservalue4LaTeX((("\text{" * val7) * "}")) → Equaliservalue6LaTeX((("\text{" * val8) * "}")) → Equaliservalue7LaTeX((("\text{" * val9) * "}")) → Equaliservalue8LaTeX((("\text{" * val2) * "}")) → Equaliservalue1LaTeX((("\text{" * val6) * "}")) → Equaliservalue5Polygon((7.8, y(Corner[1])), Corner[2], Corner[3], (7.8, y(Corner[4]))) → Mask, a, b, e, hLaTeX((("\text{" * val1) * "}")) → Equaliservalue9LaTeX((("\text{" * val10) * "}")) → Equaliservalue10LaTeX("\text{Goals}") → Datakittext1Polygon(PolyA, PolyB, PolyC, PolyD) → Mask2, a_1, b_1, c_1, d_1Sort(list1) → sortElement(sort, 1) → sort1Element(sort, 2) → sort2Element(sort, 3) → sort3Element(sort, 4) → sort4Element(sort, 5) → sort5Element(sort, 6) → sort6Element(sort, 7) → sort7Element(sort, 8) → sort8Element(sort, 9) → sort9Element(sort, 10) → sort10Segment((0, 0), (0, 5)) → iSequence(Segment[A_0 + (i, 0), A_0 + (i, (-0.3))], i, 0, 5) → Scalelist1Sequence(Segment[A_0 + (i, 0), A_0 + (i, 0.3)], i, 0, 5) → Scalelist2Segment(A, B) → jDotPlot(sort) → DotplotLaTeX("\text{The following table shows the number of goals scored each game by a soccer team.Determine which measure of center,}") → QuestionTextLaTeX("\text{the mean or the median,would best describe the average data value for the data set.Describe the variation in the }") → text2LaTeX("\text{data set. }") → text3LaTeX("\text{Order the data from least to greatest. }") → text4LaTeX("\text{Ordering the data helps in understanding whether it contains an outlier and what the shape is. }") → text5LaTeX((((((((((((((((((((("\text{The ordered data for the number of goals is \textcolor{#000099}{" * sort1) * "}, \textcolor{#000099}{") * sort2) * "}, \textcolor{#000099}{") * sort3) * "}, \textcolor{#000099}{") * sort4) * "}, \textcolor{#000099}{") * sort5) * "}, \textcolor{#000099}{") * sort6) * "}, \textcolor{#000099}{") * sort7) * "}, \textcolor{#000099}{") * sort8) * "}, \textcolor{#000099}{") * sort9) * "}, \textcolor{#000099}{") * sort10) * "}. }")) → text6LaTeX("\text{Determine which measure of center best describes the average data value. }") → text8LaTeX("\text{Create a dot plot of the data. }") → text10LaTeX("\text{or the mean would be valid measures of center for this set.}") → text13LaTeX("\text{Calculate the mean. }") → text14LaTeX((((((((((((((((((((("\text{\textcolor{#000099}{\frac{" * sort1) * "+") * sort2) * "+") * sort3) * "+") * sort4) * "+") * sort5) * "+") * sort6) * "+") * sort7) * "+") * sort8) * "+") * sort9) * "+") * sort10) * "}{10}}}")) → text17Sum({sort1, sort2, sort3, sort4, sort5, sort6, sort7, sort8, sort9, sort10}) → sumMedian({sort1, sort2, sort3, sort4, sort5, sort6, sort7, sort8, sort9, sort10}) → medianMean({sort1, sort2, sort3, sort4, sort5, sort6, sort7, sort8, sort9, sort10}) → meanLaTeX((("\text{\textcolor{#000099}{=\frac{" * sum) * "}{10}}}")) → text18LaTeX((("\text{\textcolor{#000099}{=" * mean) * "}}")) → text19LaTeX("\text{Calculate the median. }") → text21LaTeX("\text{This data does not have any values that are much greater or less than the rest of the values in the set,}") → text7LaTeX("\text{so there are no outliers.}") → text7_1LaTeX("\text{determine the median. }") → text24LaTeX("\text{Describe the variation in the data set.}") → text26LaTeX("\text{Draw a line from each dot to the rectangle.The completed box plot follows. }") → text39LaTeX("\text{Dot plots help determine whether data is symmetric,skewed left,or skewed right. }") → text9LaTeX("\text{sum of the number of goals scored divided by the number of games played,\textcolor{#000099}{10}. }") → text16LaTeX((("\text{is \textcolor{#000099}{" * median) * "}.}")) → text25LaTeX("\text{Determine the median,first quartile,and third quartile for the number of goals scored each game. }") → text30LaTeX((("\text{We have already determined that the median is \textcolor{#000099}{" * median) * "}.}")) → text31LaTeX("\text{The third quartile,\textcolor{#000099}{Q₃},is the middle value in the second half of the data.The middle value of the }") → text32LaTeX((((("\text{second half of the data is \textcolor{#000099}{" * sort8) * "}.Therefore,the third quartile is \textcolor{#000099}{") * sort8) * "}. }")) → text35LaTeX((((("\text{Create a rectangle that begins at \textcolor{#000099}{" * sort3) * "} and extends to \textcolor{#000099}{") * sort8) * "} to represent the first and third quartile.Draw}")) → text36LaTeX((("\text{a vertical line at \textcolor{#000099}{" * median) * "} to represent the median. }")) → text37LaTeX((((("\text{Place dots at the smallest and largest values,\textcolor{#000099}{" * sort1) * "} and \textcolor{#000099}{") * sort10) * "}. }")) → text38LaTeX("\text{\mathbf{Dot \;plot} a frequency plot that shows the number of times a response occurred in a}") → text43LaTeX("\text{data set,where each data value is represented by a dot.}") → text44LaTeX("\text{the number of data points.}") → text46LaTeX("\text{\mathbf{Mean} the average value of a data set,found by summing all values and dividing by}") → text45LaTeX("\text{Goals}") → Diagram_text42LaTeX("\text{The data is fairly symmetric.As determined in step 1,none of the values are much greater}") → text11LaTeX("\text{ or much less than the other values,so there is no outlier.Therefore,either the median}") → text12LaTeX("\text{Box plots show the variation of a data set,so create a box plot of the data. }") → text27LaTeX("\text{For the number of goals scored each game,begin by creating a number line that covers the range}") → text28LaTeX("\text{of the set of data.The data ranges from \textcolor{#000099}{0} to \textcolor{#000099}{5},so this is a reasonable range for the number line. }") → text29LaTeX("\text{The first quartile,\textcolor{#000099}{Q₁},is the middle value in the first half of the data.The middle value of the }") → text33LaTeX((((("\text{first half of the data is \textcolor{#000099}{" * sort3) * "}.Therefore,the first quartile is \textcolor{#000099}{") * sort3) * "}. }")) → text34LaTeX("\text{the first and third quartiles,indicating a symmetric distribution. }") → text41TableText({{LaTeX["\text{Game}"], LaTeX["\text{ \textcolor{#000099}{1}}"], LaTeX["\text{ \textcolor{#000099}{2}}"], LaTeX["\text{ \textcolor{#000099}{3}}"], LaTeX["\text{ \textcolor{#000099}{4}}"], LaTeX["\text{ \textcolor{#000099}{5}}"], LaTeX["\text{ \textcolor{#000099}{6}}"], LaTeX["\text{ \textcolor{#000099}{7}}"], LaTeX["\text{ \textcolor{#000099}{8}}"], LaTeX["\text{ \textcolor{#000099}{9}}"], LaTeX["\text{ \textcolor{#000099}{10}}"]}, {LaTeX["\text{Goals}"], LaTeX[(("\text{\textcolor{#000099}{\;" * val1) * "}}")], LaTeX[(("\text{\textcolor{#000099}{\;" * val2) * "}}")], LaTeX[(("\text{\textcolor{#000099}{\;" * val3) * "}}")], LaTeX[(("\text{\textcolor{#000099}{\;" * val4) * "}}")], LaTeX[(("\text{\textcolor{#000099}{\;" * val5) * "}}")], LaTeX[(("\text{\textcolor{#000099}{\;" * val6) * "}}")], LaTeX[(("\text{\textcolor{#000099}{\;" * val7) * "}}")], LaTeX[(("\text{\textcolor{#000099}{\;" * val8) * "}}")], LaTeX[(("\text{\textcolor{#000099}{\;" * val9) * "}}")], LaTeX[(("\text{\textcolor{#000099}{\;" * val10) * "}}")]}}, "l|_") → TabularFormBoxPlot(1.5, 0.5, sort1, sort3, median, sort8, sort10) → BoxplotLaTeX((((("\text{The data varies from \textcolor{#000099}{" * sort1) * "\; goals} to \textcolor{#000099}{") * sort10) * " \;goals} and is evenly distributed.The median is halfway between }")) → text40LaTeX("\text{The mean is the sum of the values divided by the number of values.In this case,the mean is the}") → text15LaTeX("\text{\mathbf{Median} \textcolor{#000099}{1.} The middle-most value of a data set;\textcolor{#000099}{50%} of the data is less than this}") → text47LaTeX("\text{value,and \textcolor{#000099}{50%} is greater than it.}") → text48LaTeX("\text{\textcolor{#000099}{2}.The segment joining the vertex to the midpoint of the opposite side.}") → text49LaTeX("\text{The data set has an even number of values,so take the average of the two middle values to}") → text22LaTeX((((("\text{The two middle values when the data is ordered from least to greatest are \textcolor{#000099}{" * sort5) * "} and \textcolor{#000099}{") * sort6) * "},so the median}")) → text23LaTeX((("\text{The mean is \textcolor{#000099}{" * mean) * "}.}")) → text20