
绝对值方程的根 by cemccourseware
几何画板及绘图内容加载中,请稍等……
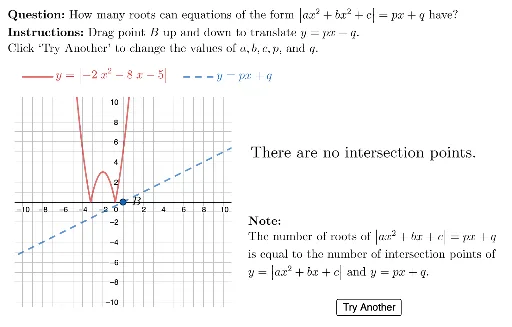
本范例演示了绝对值方程的根的图形表示。涉及的核心数学概念包括绝对值函数、方程求解、根的统计特性、线性回归、极限和逻辑。作图要点包括使用Random、Element、Expand、RemoveUndefined、Derivative、Intersect、Mirror、Union、Zip、Point、Line、Length、Polygon、Segment、LaTeX、CountIf等GeoGebra命令和对象。适合高中阶段学习函数和方程的学生使用。
GeoGebra 命令及参数
Random(-5, 5) → hValRandom(1, 3) → kValElement(lineSlopes, Random[1, 4]) → slopeExpand((aVal * (x - hVal)^(2)) + kVal) → fRemoveUndefined({Intersect[f, xAxis]}) → fRootsDerivative(f) → f'Intersect(f, f'(x) = slope) → TangentPointMirror(TangentPoint, x = hVal) → alternateTangentUnion(fRoots, {Fvertex, TangentPoint, alternateTangent}) → FkeyPtsZip((0, y(A) - (slope * x(A))), A, FkeyPts) → keyYInterceptsUnion(Sequence[(0, i), i, -10, 10, 0.5], keyYIntercepts) → allSliderValsPoint(allSliderVals) → BLine(A, B) → gRemoveUndefined(Union[{Intersect[f, g]}, {Intersect[(-f(x)), g]}]) → allIntersectPtsRemoveUndefined(Zip[If[y(A) ≥ 0, A], A, allIntersectPts]) → positiveIntPtsLength(positiveIntPts) → numIntersectionPtsPolygon({(vbLeft, vbBottom), (vbLeft, vbTop), (vbRight, vbTop), (vbRight, vbBottom)}) → viewboxZip(If[IsInRegion[A, viewbox], true], A, positiveIntPts) → visibleIntPtsSegment((0, floor(vbBottom + 3)), (0, floor(vbTop))) → yAxisVerticalSliderLaTeX(Expand[f]) → LblfLaTeX("\text{\textbf{Note: } \\The number of roots of \(\left\vert ax^2 + bx +c \right\vert =px+q\) \\is equal to the number of intersection points of \\\(y=\left\vert ax^2 + bx + c\right\vert\) and \(y=px+q\).}") → txtNoteCountIf(x ≟ true, visibleIntPts) → numVisibleLaTeX(If[numIntersectionPts ≟ numVisible, "", (("Only " * If[numVisible ≟ 3, "three are", If[numVisible ≟ 2, "two are", "one is"]]) * " visible on the graph.")]) → fbNumVisibleLaTeX(("There " * If[numIntersectionPts ≟ 0, "are no intersection points.", If[numIntersectionPts ≟ 1, "is one intersection point.", (("are " * If[numIntersectionPts ≟ 2, "two", If[numIntersectionPts ≟ 3, "three", "four"]]) * " intersection points. ")]])) → fbNumIntPointsLaTeX((((("\text{" * fbNumIntPoints) * "\\") * fbNumVisible) * "}")) → txtNumIntPtsRemoveUndefined(Zip[If[IsInRegion[A, viewbox], A], A, positiveIntPts]) → allIntersectionsInRegionLaTeX((((("\text{\textbf{Question: }" * MainInstruc) * "\\\textbf{Instructions: }") * SpecInstruc) * "}")) → allInstrucSegment(Element[legendAnchors, 1], Element[legendAnchors, 1] + (3, 0)) → fxLegendSegment(Element[legendAnchors, 2], Element[legendAnchors, 2] + (3, 0)) → lineLegendLaTeX((("\vphantom{\dfrac{1}{2}}y=\left\vert " * Lblf) * " \right\vert")) → lblGraph
AI 绘图提示语参考
画一个绝对值方程的根的图形,展示绝对值函数与线性函数的交点。首先绘制绝对值函数图像,再绘制与之相交的直线。标记所有交点,并突出显示在视图范围内的交点。计算并显示交点数量,以及视图范围内的交点数量。最后,在左侧添加函数表达式和说明文字,解释交点数量与方程根的关系。
以上提示语为根据原始绘图命令整理而来,仅供参考。