
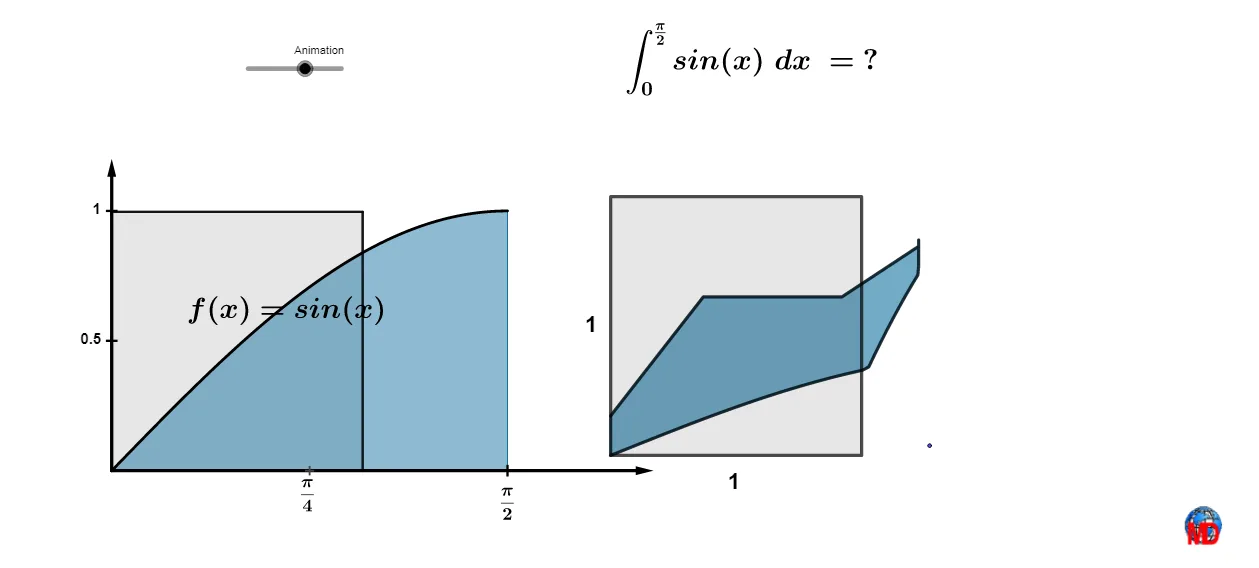
无字证明:0到pi/2之间sin(x)的积分
几何画板及绘图内容加载中,请稍等……
①这个范例通过图形演示了0到pi/2之间sin(x)的积分计算过程;②涉及的核心数学概念包括积分、三角函数和几何图形;③作图要点——从下方『构造摘要』提炼用到了Polygon(多边形)、Sequence(数列)、Midpoint(中点)、Join(连接)、Integral(积分)、Point(点)、Length(长度)、Vector(向量)、Translate(平移)、PolyLine(多段线)、Centroid(质心)、Line(直线)、Intersect(交点)等GeoGebra命令/对象;④适合高中及以上学生学习和理解微积分基本定理。
GeoGebra 命令及参数
Polygon(I, J, 4) → poly1, g, h, i, j, K, LSequence(Translate[I, Vector[(i * Vector[I, J])]], i, 0, 1, 1 / n) → l2Midpoint(K, I) → NJoin(Sequence[Rotate[l2, i, N], i, 0, (2 * π), (2 * π / 4)]) → l3Sequence((i, f(i)), i, 0, π / 2, 1 / n) → l1Sequence(Translate[M, Vector[(i * Vector[M, O])]], i, 0, 1, 1 / 16) → l1bSequence(Translate[O, Vector[(i * Vector[O, (0, 0)])]], i, 0, 1, 1 / 20) → l1cJoin({l1, l1b, l1c}) → l6Sequence(Vector[Element[l6, i], Element[l3, i]], i, 1, Length[l3]) → l4Sequence(Translate[Element[l6, i], Vector[(Animation / 10 * Element[l4, i])]], i, 1, Length[l6]) → l5Polygon(A, B, C, D) → poly4, a, b, c, dIntegral(f, 0, 1.5707963267948966) → ePoint(poly4) → EPolygon(l5) → poly2Length(l3) → lLength(l6) → kVector((0, 0), I) → uPolygon(P, E, 4) → poly3, m, q, r, s, Q, RTranslate(poly3, Vector[(Animation / 10 * u)]) → poly3'PolyLine(l5) → tCentroid(poly3') → SLine(S, yAxis) → f_1Intersect(f_1, poly3') → T, ULine(S, xAxis) → g_1Intersect(g_1, poly3') → V, WVector((0, 0), (0, 1.2)) → vVector((0, 0), (2.15, 0)) → wMidpoint(P, O) → Z
AI 绘图提示语参考
绘制一个几何证明图,展示正弦函数在0到π/2区间内的积分。先画一个正方形,将其旋转复制四次形成对称图案,再在坐标轴上生成正弦曲线上的点列,并平移这些点与旋转后的正方形顶点对应,用线段连接对应点形成动态网格。添加一个矩形表示积分面积,并在矩形内放置一个旋转的正方形,通过其中心画水平与垂直辅助线,与矩形边相交,展示面积关系。整体呈现函数曲线、网格与几何形状的视觉化积分过程。
以上提示语为根据原始绘图命令整理而来,仅供参考。