
饼图制作
几何画板及绘图内容加载中,请稍等……
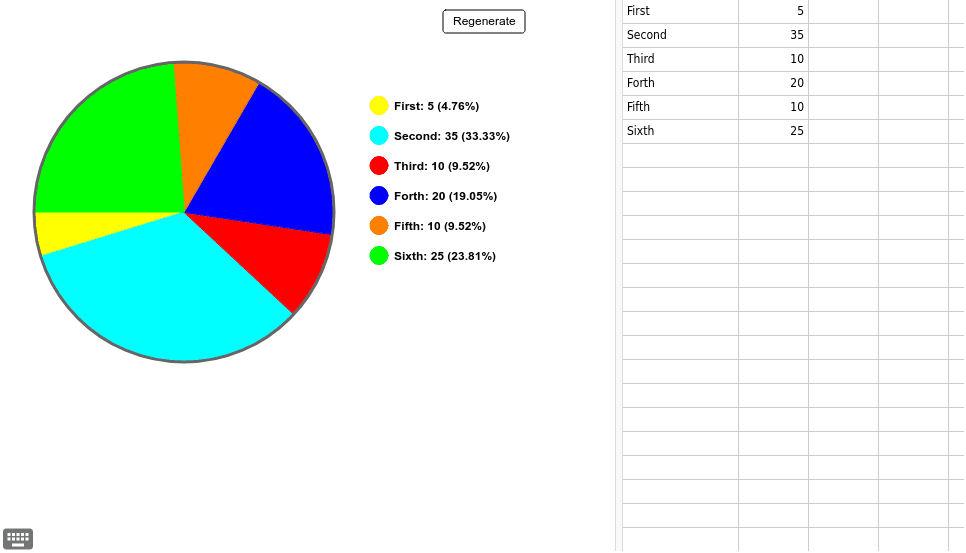
本范例展示了如何在GeoGebra中制作饼图。通过脚本创建各个扇区,涉及的核心数学概念包括比例和角度。使用了Circle, Length, Zip, Sequence, CircleSector等命令。适合初中及以上学生学习数据展示和统计分析。
GeoGebra 命令及参数
Circle(PieMidpoint, PieRadius) → PieCircleLength(data) → nZip(Element[A, 2], A, data) → data_{prep}Sequence(Sum[data_{prep}, i], i, 1, n) → data_{sum}Sequence(Point[PieCircle, Element[data_{sum}, i] / Element[data_{sum}, n]], i, 1, n) → PiePointsSequence(Text[Element[data, i, 1] + ": " + (Element[data, i, 2]) + " (" + (Element[data, i, 2] / Element[data_{sum}, n] * 100) + "%)", LegendTopLeft - ((-LegendSpacing) / 2, (i - 1) * LegendSpacing)], i, 1, n) → LegendLabelsCircleSector(PieMidpoint, Element[PiePoints, 6], Element[PiePoints, 1]) → sector_{1}Circle(LegendTopLeft - (0, -0.1499999999999999 * LegendSpacing), LegendSpacing * 0.3) → sector_{1}cCircleSector(PieMidpoint, Element[PiePoints, 1], Element[PiePoints, 2]) → sector_{2}Circle(LegendTopLeft - (0, 0.8500000000000001 * LegendSpacing), LegendSpacing * 0.3) → sector_{2}cCircleSector(PieMidpoint, Element[PiePoints, 2], Element[PiePoints, 3]) → sector_{3}Circle(LegendTopLeft - (0, 1.85 * LegendSpacing), LegendSpacing * 0.3) → sector_{3}cCircleSector(PieMidpoint, Element[PiePoints, 3], Element[PiePoints, 4]) → sector_{4}Circle(LegendTopLeft - (0, 2.85 * LegendSpacing), LegendSpacing * 0.3) → sector_{4}cCircleSector(PieMidpoint, Element[PiePoints, 4], Element[PiePoints, 5]) → sector_{5}Circle(LegendTopLeft - (0, 3.85 * LegendSpacing), LegendSpacing * 0.3) → sector_{5}cCircleSector(PieMidpoint, Element[PiePoints, 5], Element[PiePoints, 6]) → sector_{6}Circle(LegendTopLeft - (0, 4.85 * LegendSpacing), LegendSpacing * 0.3) → sector_{6}c
AI 绘图提示语参考
绘制一个饼图,表示一组数据。首先画一个圆作为饼图的基础,然后根据数据的比例计算每个扇区的角度,依次绘制六个扇区,每个扇区代表数据中的一个类别,并在每个扇区旁边添加相应的标签,显示数据值和百分比。
以上提示语为根据原始绘图命令整理而来,仅供参考。