
Park高中学生人数变化趋势
几何画板及绘图内容加载中,请稍等……
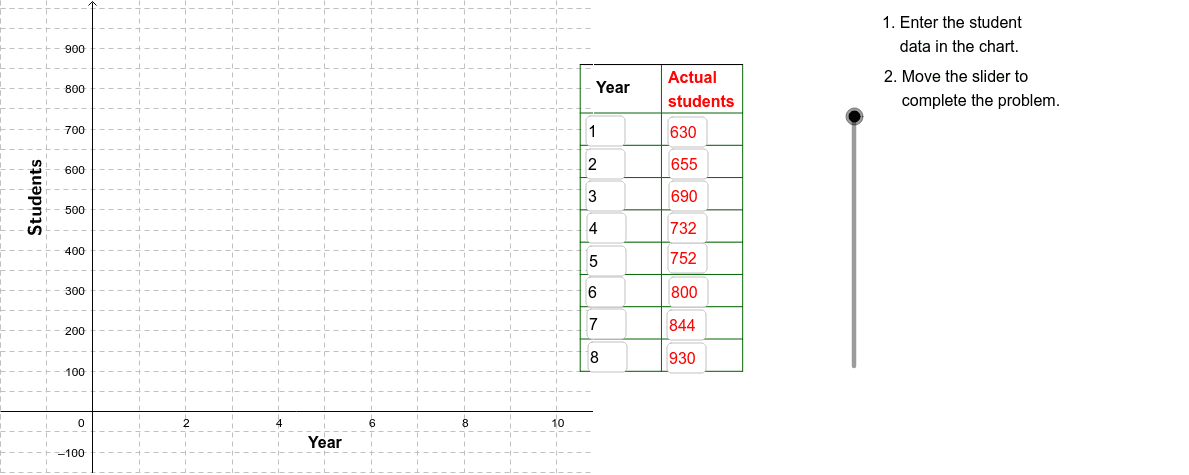
该范例展示了Park高中过去8年学生人数的变化趋势。它涉及指数函数、散点图和数据拟合等核心数学概念。通过使用Corner、Textfield、Sequence、Segment、Polygon等GeoGebra命令,可以直观地展示数据的变化。适合初中数学教学使用。
GeoGebra 命令及参数
Corner(2) → Corn2Corner(3) → Corn3Textfield(A2) → InA2Textfield(A3) → InA3Textfield(A4) → InA4Textfield(A5) → InA5Textfield(A6) → InA6Textfield(A7) → InA7Textfield(A8) → InA8Textfield(A9) → InA9Textfield(B9) → InB9Textfield(B8) → InB8Textfield(B7) → InB7Textfield(B6) → InB6Textfield(B5) → InB5Textfield(B4) → InB4Textfield(B3) → InB3Textfield(B2) → InB2Sequence(Segment[(10.5, 100 + (80 * j)), (14, 100 + (80 * j))], j, 0, 8) → LnListSequence(Segment[(14, 100 + (80 * j)), (16, 100 + (80 * j))], j, 0, 8) → LnList3Sequence(Segment[(10.5 + (1.75 * j), 100), (10.5 + (1.75 * j), 860)], j, 0, 2) → LnList2Segment((10.5, 860), (14, 860)) → Top1Segment((14, 860), (16, 860)) → Top2Segment((16, 100), (16, 860)) → Side1Polygon((0.5 * Corner[1]) + (0.5 * Corner[2]), Corner[2], Corner[3], (0.5 * Corner[3]) + (0.5 * Corner[4])) → poly1, b, c, d, eVerticalText("Students") → Students
AI 绘图提示语参考
画一个表示过去8年高中学生人口趋势的图表,包含散点图和拟合曲线,用线段表示数据变化,并标注关键点,背景为网格,顶部和侧面用线段封闭,整体呈现上升趋势。
以上提示语为根据原始绘图命令整理而来,仅供参考。