
正态分布曲线演示 by George Sturr
几何画板及绘图内容加载中,请稍等……
所属专题
Statistics Demonstrations
Statistics Demonstrations
Statistics Demonstrations
Statistics Demonstrations
Statistics Demonstrations
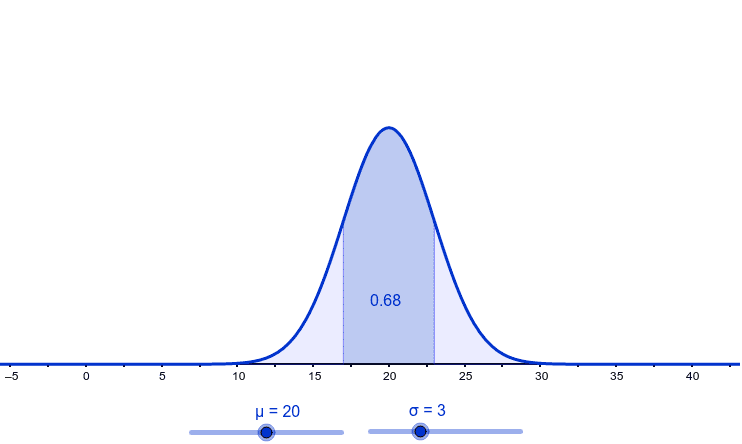
这个范例演示了如何通过改变正态分布的参数来调整正态曲线的中心和宽度。它涉及正态分布的核心概念,包括均值和标准差。通过使用GeoGebra命令如Normal、Segment、Integral等,可以动态地观察参数变化对曲线的影响。适合高中数学教学和学习概率统计的学生。
GeoGebra 命令及参数
Normal(μ, σ, x) → gSegment((μ, 0), (μ, g(μ))) → cSegment((μ + σ, 0), (μ + σ, g(μ + σ))) → bSegment((μ - σ, 0), (μ - σ, g(μ - σ))) → aIntegral(g, μ - σ, μ + σ) → dIntegral(g, μ - (4 * σ), μ - σ) → eIntegral(g, μ + σ, μ + (4 * σ)) → f