
LR3-02-CYU2:判断两个线性表示是否等价
几何画板及绘图内容加载中,请稍等……
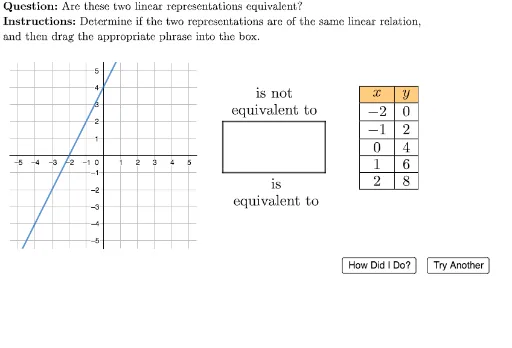
该范例通过交互式练习,让学生判断两个线性表示(如线性方程组或线性变换的矩阵形式)是否等价。核心数学概念是线性表示、等价性以及线性方程组的解集比较。作图要点包括:使用GeoGebra的Polygon命令构建立方体或矩形区域,通过UnicodeToLetter和LaTeX生成数学符号,利用Random和If随机生成题目,用IsInRegion检测点是否在区域内,配合TableText展示数据,并通过按钮(如TryAnother)和反馈对象(如correct、incorrect)实现自测。适合高中或大学低年级线性代数课程,用于巩固线性表示等价性的判断方法。
GeoGebra 命令及参数
Polygon(A, B, C, D) → box, a, b, c, d_1UnicodeToLetter(10007) → xmarkUnicodeToLetter(10003) → cmarkPolygon(anchorEquivalent, anchorEquivalent + (widthOfEquivalent, 0), anchorEquivalent + (widthOfEquivalent, (-heightOfEquivalent)), anchorEquivalent + (0, (-heightOfEquivalent))) → dragBoxEquivalent, f, g, h, iPolygon(anchorNotEquivalent, anchorNotEquivalent + (widthOfNotEquivalent, 0), anchorNotEquivalent + (widthOfNotEquivalent, (-heightOfNotEquivalent)), anchorNotEquivalent + (0, (-heightOfNotEquivalent))) → dragBoxNotEquivalent, j, k, l, mIsInRegion(midAnchorEquivalent, box) → isEquivalentInRegionIsInRegion(midAnchorNotEquivalent, box) → isNotEquivalentInRegionIf(Random[0, 1] ≟ 0, Random[-4, -1], Random[1, 4]) → slope1Random(-5, 5) → intercept1Random(0, 1) → samenessIndicatorIf(samenessIndicator ≟ 0, slope1, If[Random[0, 1] ≟ 0, Random[-4, -1], Random[1, 4]]) → slope2If(samenessIndicator ≟ 0, intercept1, Random[-5, 5]) → intercept2Zip(line1(A), A, xValues) → yValues1Zip(line2(A), A, xValues) → yValues2TableText({Join[{{LaTeX["\cellcolor{#ffcc80}{x}"]}, xValues}], Join[{{LaTeX["\cellcolor{#ffcc80}{y}"]}, yValues1}]}, "|_vc") → table1TableText({Join[{{LaTeX["\cellcolor{#ffcc80}{x}"]}, xValues}], Join[{{LaTeX["\cellcolor{#ffcc80}{y}"]}, yValues2}]}, "|_vc") → table2LaTeX(("y=" * Polynomial[line1])) → equation1LaTeX(("y=" * Polynomial[line2])) → equation2Random(1, 4) → typeLaTeX((((((((((("\text{The two representations are of the same linear relation if they\\have identical values for the slope and \(y\)-intercept. The first representation has a\\slope of \(" * slope1) * "\) and a \(y\)-intercept of \(") * intercept1) * "\). The second representation has a slope of \(") * slope2) * "\) and a\\\(y\)-intercept of \(") * intercept2) * "\). \textbf{Therefore, they are ") * If[¬areSame, "not ", ""]) * "equivalent.}}")) → feedbackLaTeX("\text{Please drag a phrase into the box.}") → errorNoneDraggedLaTeX("\text{Only drag one phrase into the box.}") → errorBothDraggedLaTeX("\text{\textbf{Question: }Are these two linear representations equivalent?\\\textbf{Instructions: }Determine if the two representations are of the same linear relation,\\and then drag the appropriate phrase into the box.}") → TEXT
AI 绘图提示语参考
绘制一个包含两个线性方程表格的交互式教学图形。左侧显示两个数据表,分别列出x值及对应的y值,右侧显示两个线性方程及其斜率与截距。下方设置两个拖拽区域,分别标记为“等价”和“不等价”,用于学生判断两个线性表示是否等价。图形背景为矩形区域,包含随机生成的直线方程,并配有反馈文字说明判断结果。整体布局清晰,适合课堂练习。
以上提示语为根据原始绘图命令整理而来,仅供参考。