
线性回归与数据分析GeoGebra范例
几何画板及绘图内容加载中,请稍等……
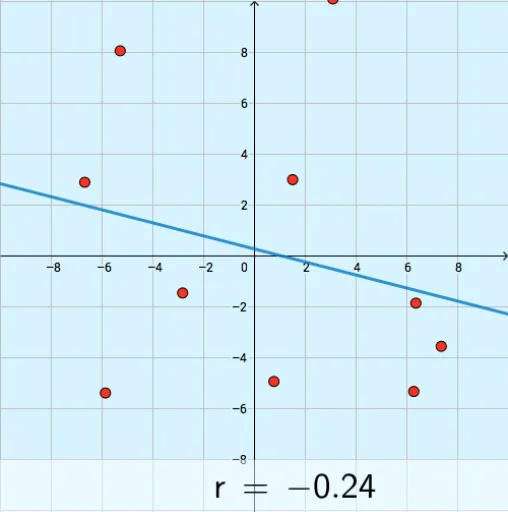
①本范例通过GeoGebra演示线性回归分析,展示如何根据数据点拟合最佳拟合线并计算相关系数;②涉及的核心数学概念包括线性回归、相关系数(PMCC)、数据分布、频率分布等;③作图要点——使用了Corner, Polygon, PointIn, FitPoly, PMCC, LaTeX等GeoGebra命令与对象,如R, Q, L, M, K, N等点及文本对象;④适合高中数学教学,用于理解数据分析与统计建模方法。
GeoGebra 命令及参数
Corner(4) → RCorner(3) → QCorner(2) → LCorner(1) → KPolygon(N, M, Q, R) → q2, g, h, i, jPointIn(q2) → BPointIn(q2) → CPointIn(q2) → EPointIn(q2) → FPointIn(q2) → GPointIn(q2) → HPointIn(q2) → IPointIn(q2) → JPointIn(q2) → DPointIn(q2) → AFitPoly(L_1, 1) → fPMCC(L_1) → rLaTeX(r, true, true) → text1Polygon(K, L, M, N) → q1, k, l, m, n