
线性函数图像绘制示例 by Walch Education
几何画板及绘图内容加载中,请稍等……
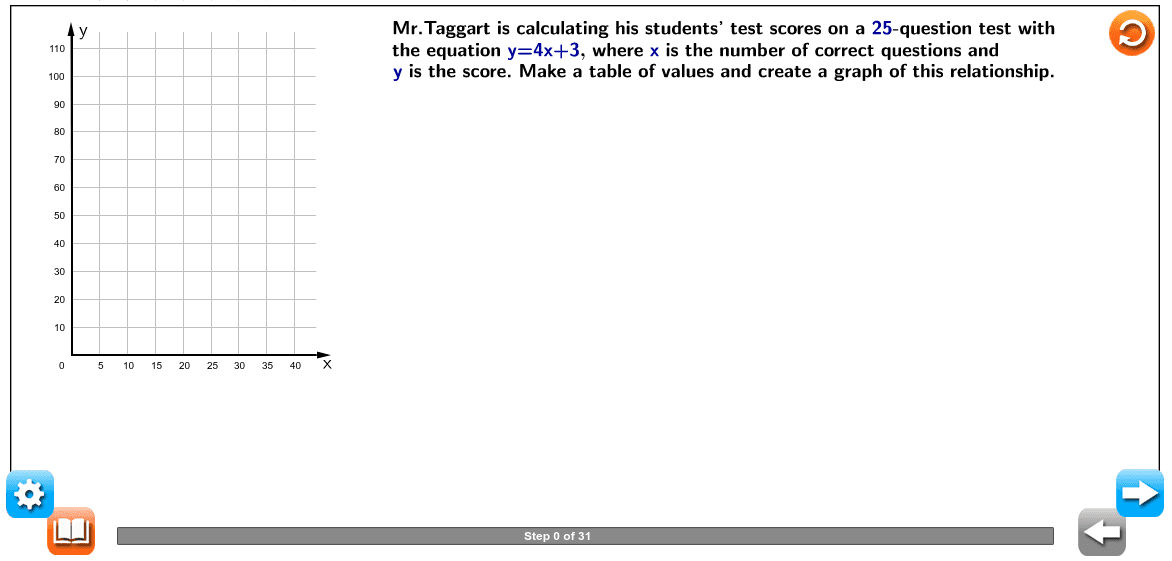
①本范例演示了如何使用 GeoGebra 绘制线性函数 y=4x+3 的图像,并展示其与坐标轴的交点及斜率特性;②涉及的核心数学概念包括线性函数、斜率、截距、坐标系、函数图像绘制;③作图要点提炼自构造摘要,使用了 Polygon(多边形)、Point(点)、Segment(线段)、Vector(向量)、LaTeX(公式显示)、VerticalText(垂直文本)、TableText(表格文本)等命令/对象;④适合初中及以上学生学习函数图像绘制、线性函数性质及 GeoGebra 软件操作。
GeoGebra 命令及参数
Polygon(A, B, C, D) → poly1, a, b, c, dPoint(a) → FPolygon(E, A, F, G) → poly2, e, a_1, f, gPoint(yAxis) → HSegment(H, I) → hPoint(xAxis) → JSegment(I, J) → iPoint(yAxis) → KPoint(yAxis) → LPoint(xAxis) → MVector(K, M) → vLaTeX("\text{Determine values that make the equation true.}") → text1_3LaTeX("\text{Given equation}") → text1_{11}LaTeX("\text{Substitute \textcolor{#000099}{0} for \textcolor{#000099}{x}.}") → text1_{18}LaTeX("\text{Simplify.}") → text1_{19}LaTeX("\text{Given equation}") → text1_{20}LaTeX("\text{Simplify.}") → text1_{22}LaTeX("\text{Given equation}") → text1_{23}LaTeX("\text{Simplify.}") → text1_{34}LaTeX("\text{Substitute \textcolor{#000099}{10} for \textcolor{#000099}{x}.}") → text1_{26}LaTeX("\text{Given equation}") → text1_{36}LaTeX("\text{Simplify.}") → text1_{40}LaTeX("\text{Organize these values in a table.}") → text1_6LaTeX("\text{\textcolor{#000099}{x}-values in one column and \textcolor{#000099}{y}-values in the other. }") → text1_{31}LaTeX("\text{Plot the ordered pairs from the table on a coordinate plane. }") → text1_{32}LaTeX("\text{Plot these ordered pairs on a coordinate plane. }") → text1_{42}LaTeX("\text{Label the \textcolor{#000099}{x}-axis “Number of correct questions” and the }") → text1_{43}LaTeX("\text{Number of correct questions}") → text1_{45}LaTeX("\text{Draw a line through the points. }") → text1_{46}LaTeX("\text{through the plotted points. }") → text1_{48}LaTeX("\text{ start at \textcolor{#000099}{x = 0} and end at \textcolor{#000099}{x = 25}. }") → text1_{51}LaTeX((("\text{Substitute \textcolor{#000099}{" * x1_1) * "} for \textcolor{#000099}{x} and solve for \textcolor{#000099}{y}. }")) → text1_9LaTeX((("\text{Substitute \textcolor{#000099}{" * x3_1) * "} for \textcolor{#000099}{x} and solve for \textcolor{#000099}{y}. }")) → text1_{27}LaTeX((("\text{Substitute \textcolor{#000099}{" * x4_1) * "} for \textcolor{#000099}{x} and solve for \textcolor{#000099}{y}. }")) → text3Polygon(R, S, T, U) → poly3, r, s, t, uVerticalText("\text{Score}") → text10Vector(K, V) → wLaTeX("\text{The solutions to the linear equation are the infinite set of points on the line. }") → text11_5Polygon(W, Z, A_1, B_1) → poly4, w_1, z_1, a_2, b_1LaTeX("\text{x}") → text12LaTeX("\text{y}") → text12_1LaTeX((((("\text{\textcolor{#000099}{y =" * c1) * "x + ") * c2) * "}}")) → text1_{13}LaTeX((((((("\text{\textcolor{#000099}{y = " * c1) * "(") * x1_1) * ") + ") * c2) * "}}")) → text1_{12}LaTeX((("\text{\textcolor{#000099}{y = " * sol1) * "}}")) → text1_{10}LaTeX((((("\text{\textcolor{#000099}{y = " * c1) * "x + ") * c2) * "}}")) → text1_{15}LaTeX((((((("\text{\textcolor{#000099}{y = " * c1) * "(") * x2) * ") + ") * c2) * "}}")) → text1_{16}LaTeX((("\text{\textcolor{#000099}{y = " * sol2) * "}}")) → text1_{17}LaTeX((((("\text{\textcolor{#000099}{y =" * c1) * "x + ") * c2) * "}}")) → text1_{14}LaTeX((((((("\text{\textcolor{#000099}{y = " * c1) * "(") * x3_1) * ") + ") * c2) * "}}")) → text1_{24}LaTeX((("\text{\textcolor{#000099}{y = " * sol3) * "}}")) → text1_{25}LaTeX((((("\text{\textcolor{#000099}{y =" * c1) * "x + ") * c2) * "}}")) → text1_{35}LaTeX((((((("\text{\textcolor{#000099}{y = " * c1) * "(") * x4_1) * ") + ") * c2) * "}}")) → text1_{37}LaTeX((("\text{\textcolor{#000099}{y = " * so4) * "}}")) → text1_{38}LaTeX((((("\text{and \textcolor{#000099}{(" * x4_1) * ",") * so4) * ")}. }")) → text1_{41}LaTeX((("\text{Coefficient of x:" * c1) * "}")) → text5Segment(PO1, PO4) → jLaTeX("\text{Substitute \textcolor{#000099}{1} for \textcolor{#000099}{x}.}") → text1_{21}LaTeX("\text{Substitute \textcolor{#000099}{1} for \textcolor{#000099}{x} and solve for \textcolor{#000099}{y}. }") → text2LaTeX("\text{Substitute \textcolor{#000099}{25} for \textcolor{#000099}{x}.}") → text1_{39}LaTeX((("\text{Constant:" * c2) * "}")) → text5_1TableText({{LaTeX["\mathbf{\;\;\;\;\;x\;\;\;\;\;}"], LaTeX[(("\text{\textcolor{#000099}{" * x1_1) * "}}")], LaTeX["\text{\textcolor{#000099}{1}}"], LaTeX[(("\text{\textcolor{#000099}{" * x3_1) * "}}")], LaTeX[(("\text{\textcolor{#000099}{" * x4_1) * "}}")]}, {LaTeX["\mathbf{\;\;\;\;\;y\;\;\;\;\;}"], LaTeX[(("\text{\textcolor{#000099}{" * sol1) * "}}")], LaTeX[(("\text{\textcolor{#000099}{" * sol2) * "}}")], LaTeX[(("\text{\textcolor{#000099}{" * sol3) * "}}")], LaTeX[(("\text{\textcolor{#000099}{" * so4) * "}}")]}}, "vc_|l") → text4LaTeX("\text{Mr.Taggart is calculating his students’ test scores on a \textcolor{#000099}{25}-question test with}") → text1LaTeX((((("\text{the equation \textcolor{#000099}{y=" * c1) * "x+") * c2) * "}, where \textcolor{#000099}{x} is the number of correct questions and}")) → text1_1LaTeX("\text{\textcolor{#000099}{y} is the score. Make a table of values and create a graph of this relationship.}") → text1_2LaTeX((((((("\text{points, substitute values for \textcolor{#000099}{x} and solve for \textcolor{#000099}{y}. Let’s use the values \textcolor{#000099}{" * x1_1) * ", 1, ") * x3_1) * ",} and \textcolor{#000099}{") * x4_1) * "}. }")) → text1_5LaTeX("\text{To create a graph of the given equation, at least two points are needed. To find the }") → text1_4LaTeX((((("\text{When \textcolor{#000099}{x = " * x1_1) * "}, \textcolor{#000099}{y = ") * sol1) * "}. }")) → text1_7LaTeX((("\text{When \textcolor{#000099}{x = 1}, \textcolor{#000099}{y =" * sol2) * "}. }")) → text1_8LaTeX((((("\text{When \textcolor{#000099}{x = " * x3_1) * "}, \textcolor{#000099}{y = ") * sol3) * "}. }")) → text1_{28}LaTeX((((("\text{When \textcolor{#000099}{x = " * x4_1) * "}, \textcolor{#000099}{y = ") * so4) * "}. }")) → text1_{29}LaTeX("\text{Create a table of the values determined in the previous step, with }") → text1_{30}LaTeX((((((((((("\text{The ordered pairs from the table are \textcolor{#000099}{(" * x1_1) * ", ") * sol1) * "), (1,") * sol2) * "), (") * x3_1) * ",") * sol3) * "),} }")) → text1_{33}LaTeX("\text{\textcolor{#000099}{y}-axis “Score.”}") → text1_{44}LaTeX((((("\text{Since the given equation, \textcolor{#000099}{y = " * c1) * "x + ") * c2) * "}, is a linear equation, draw a line}")) → text1_{47}LaTeX("\text{get from \textcolor{#000099}{0} to \textcolor{#000099}{25} answers correct. Therefore, the line must }") → text1_{50}LaTeX("\text{Because there are only \textcolor{#000099}{25} questions on the test, a student could }") → text1_{49}LaTeX("\text{\mathbf{quadratic\; function} a function that can be written in the form \textcolor{#000099}{f(x)=ax^2+bx+c}, }") → text11LaTeX("\text{where \textcolor{#000099}{a≠0}. The graph of any quadratic function is a parabola.}") → text11_1LaTeX("\text{\mathbf{linear\; equation} an equation that can be written in the form \textcolor{#000099}{ax+by=c}, }") → text11_2LaTeX("\text{ in which \textcolor{#000099}{m} is the slope, \textcolor{#000099}{b} is the \textcolor{#000099}{y}-intercept, and the graph is a straight line. }") → text11_4LaTeX("\text{where \textcolor{#000099}{a, \, b,} and \textcolor{#000099}{c} are rational numbers; can also be written as \textcolor{#000099}{ y=mx+b}, }") → text11_3
AI 绘图提示语参考
画一个线性函数 y=4x+3 的图像,标出它与坐标轴的交点,并展示其斜率和y截距特征。在图中,用多边形和向量表示函数的斜率,用点标记关键位置,如函数图像与x轴和y轴的交点。通过表格展示不同x值对应的y值,并在坐标系中绘制这些点,最后用直线连接这些点,形成函数图像。
以上提示语为根据原始绘图命令整理而来,仅供参考。