
散点图解读练习(LR8-01-CYU2)
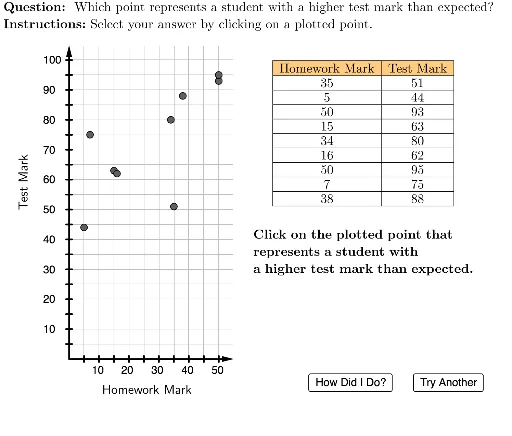
几何画板及绘图内容加载中,请稍等……
该范例是一个交互式数学练习,用于帮助学生解读散点图,理解变量之间的关系。核心数学概念包括散点图、数据分布、趋势判断以及分数、二项分布等统计与概率知识。作图要点:通过GeoGebra命令(如Element、Zip、Sequence、Polygon、Vector、TableText、Text、Circle等)构建了动态问题界面,包含问题列表、随机数据点、坐标轴刻度、反馈标记(正确/错误)等对象,实现了自动出题与即时反馈。适合中学阶段(如八年级)的统计与概率教学,也可用于课堂练习或自主复习,帮助学生掌握从散点图中提取信息、判断相关性的技能。
GeoGebra 命令及参数
Element(questionList, questionListIndex) → situationElement(situationList, situation) → currentSituationZip(A / xInc, A, xVals) → plottedXValsZip(A / yInc, A, yVals) → plottedYValsZip((A, B), A, plottedXVals, B, plottedYVals) → plottedPointsElement(plottedPoints, 8) → HElement(plottedPoints, 5) → EElement(plottedPoints, 2) → BElement(plottedPoints, 1) → AUnicodeToLetter(10007) → xmarkUnicodeToLetter(10003) → cmarkLaTeX((((("\text{" * QUESTION) * "\\") * INSTRUCTIONS) * "}")) → TEXTSequence(Segment[(i, -0.2), (i, 0.2)], i, 1, 10) → xTicksPolygon({(0, 0), (0, 21), (11, 21), (11, 0)}) → viewBoxSequence(i, i, (2 * xInc), 50, (2 * xInc)) → xTickLabelsSequence(i, i, (2 * yInc), 100, (2 * yInc)) → yTickLabelsVector((0, 0), (11, 0)) → xAxisLineVector((0, 0), (0, 21)) → yAxisLineSequence(Segment[(-0.2, i), (0.2, i)], i, 1, 20) → yTicksElement(plottedPoints, 3) → CElement(plottedPoints, 4) → DElement(plottedPoints, 6) → FElement(plottedPoints, 7) → GElement(plottedPoints, 9) → ITableText({Join[{{"\cellcolor{#ffcc80}{\text{Homework Mark}}"}, xVals}], Join[{{"\cellcolor{#ffcc80}{\text{Test Mark}}"}, yVals}]}, "|_vc") → dataRotateText(Text["\text{Test Mark}", (-3, 12), false, true], 90°) → yAxisLabelText("\text{Homework Mark}", (2, -1.5), false, true) → xAxisLabelElement({B, E, A, H}, situation) → correctPointCircle(correctPoint, 0.4) → correctCircleLaTeX((("\text{The point is " * correctPointAdjusted) * ".}")) → feedbackSequence(Text[Element[yTickLabels, i], (-1.75, (2 * i) - 0.25)], i, 1, 20) → yAxisTickLabelsSequence(Text[Element[xTickLabels, i], ((2 * i) - 0.5, -1)], i, 1, 10) → xAxisTickLabelsLaTeX((("\text{Click on the plotted point that\\represents a student with \\" * currentSituation) * ".}")) → currentInstructions
AI 绘图提示语参考
画一个带有坐标轴和刻度的散点图,横轴表示'作业成绩',纵轴表示'测试成绩',坐标轴上有刻度标记。图中包含多个随机分布的数据点,其中三个点用不同颜色突出显示。在图的右下角有一个表格,显示所有数据点的横纵坐标值。此外,有一个圆圈标记其中一个正确的数据点,旁边有文字说明该点是'正确答案'。
以上提示语为根据原始绘图命令整理而来,仅供参考。