
创建散点图:DP1B-04-P3-Q3 互动练习
几何画板及绘图内容加载中,请稍等……
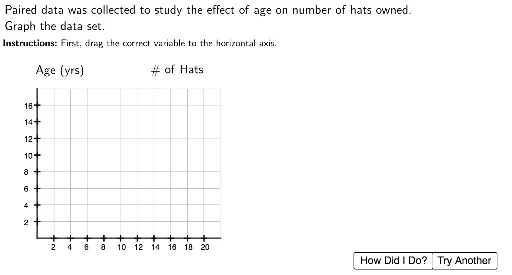
该范例演示如何通过随机生成的点集在坐标平面上创建散点图,并利用交互式界面让学生判断点是否位于指定区域内。核心数学概念包括坐标几何、点的位置关系、整数坐标以及随机数据生成。作图要点:使用 GeoGebra 的 Random、Sequence、Point 命令生成随机点,通过 Append 和 Sort 管理点列表,利用 Segment、Polygon 构造区域边界,并借助 Shuffle、Element 实现选项随机化;同时包含 RotateText 用于文本旋转,以及多个交互对象(如 PointLocation、TryAnother、CheckMark)提供即时反馈。适合中学阶段(如 IB DP 数学)学习统计绘图和坐标几何的课堂练习或自主探究。
GeoGebra 命令及参数
Append(Sequence[Sequence[(1 + j, 1 + i), i, 0, 8], j, 0, 10], PointLocation) → GridSpaceLaTeX("Which\ variable\ should\ be\ on\ which\ axis?") → InstructionsSegment(Origin, (x(Origin), yHeight)) → yaxisSegment(Origin, (xHeight, y(Origin))) → xaxisLaTeX("Time") → Item1LaTeX("Money") → Item2Polygon(Pt1, Pt1 + Corner[Item1, 3] - Corner[Item1, 4], Pt1 + Corner[Item1, 2] - Corner[Item1, 4], Pt1 + Corner[Item1, 1] - Corner[Item1, 4]) → DragSpace1, pt1, f, g, hPolygon(Pt2, Pt2 + Corner[Item2, 3] - Corner[Item2, 4], Pt2 + Corner[Item2, 2] - Corner[Item2, 4], Pt2 + Corner[Item2, 1] - Corner[Item2, 4]) → DragSpace2, pt2, i, j, kLaTeX("\checkmark") → CheckMarkLaTeX("\times") → WrongPolygon(Origin, (xHeight, y(Origin)), (xHeight, -10), (x(Origin), -10)) → WhiteSpace1, origin, l, m, nPolygon((x(Origin), yHeight), (xHeight, yHeight), (xHeight, 30), (x(Origin), 30)) → WhiteSpace2, p, q, r, sPolygon((x(Origin), -10), (x(Origin), 30), (-10, 30), (-10, -10)) → WhiteSpace3, t, a, b, cPolygon((xHeight, -10), (xHeight, 30), (30, 30), (30, -10)) → WhiteSpace4, d, e, f_1, g_1Shuffle({Item1lc, Item2lc}) → ItemListElement(ItemList, 1) → FirstItemElement(ItemList, 2) → SecondItemLaTeX("Paired\ data\ was\ collected\ to\ study\ the\ relationship\ between\ " + FirstItem + (("\\ and\ " * SecondItem)) + ". \, Which\ one\ would\ you\ place\ on\ the\ horizontal\ axis?") → InstructionsQ1LaTeX(("The\ independent\ variable\ affects\ the\\ dependent\ variable.\\ It\ is\ likely\ that\ " * Item1lc) + "\\ affects\ " + Item2lc + "\ so\ we\\ identify\ " + Item1lc + "\ as\ the\\ independent\ variable\ and\ place\ it\\ on\ the\ horizontal\ axis.") → FeedbackQ1LaTeX("Drag\ a\ variable\ onto\ the\ horizontal\ axis\\ before\ checking\ your\ work.") → FeedbackNotStartedSequence((1 + i, 1), i, 1, 10) → XPointLocationsSequence((1, 1 + i), i, 1, 8) → YPointLocationsSequence(Text[(ymult * i), Element[YPointLocations, i] - (0.79, 0.2)], i, 1, 9) → YLabelsSequence(Text[(xmult * i), Element[XPointLocations, i] - (0.18, 0.7)], i, 1, 10) → XLabelsRotateText(LaTeX[Item2], π / 2) → YLabelLaTeX(Item1) → XLabelPoint(GridSpace) → Point1Point(GridSpace) → Point2Point(GridSpace) → Point3Point(GridSpace) → Point4Point(GridSpace) → Point6Point(GridSpace) → Point5Sort({Point1, Point2, Point3, Point4, Point5, Point6}) → PointsSort({(x1 / xmult, y1 / ymult), (x2 / xmult, y2 / ymult), (x3 / xmult, y3 / ymult), (x4 / xmult, y4 / ymult), (x5 / xmult, y5 / ymult), (x6 / xmult, y6 / ymult)} + {(1, 1), (1, 1), (1, 1), (1, 1), (1, 1), (1, 1)}) → AnswerSequence(TLPoint - (0, (i * Height)), i, 1, 7) → LeftPtsSequence(TRPoint - (0, (i * Height)), i, 1, 7) → RightPtsSegment(TMPoint, BMPoint) → h_1Segment(TLPoint, Element[LeftPts, 7]) → LeftSegmentSegment(TRPoint, Element[RightPts, 7]) → RightSegmentSequence(Segment[Element[LeftPts, i], Element[RightPts, i]], i, 1, 7) → SegmentsSegment(TLPoint, TRPoint) → TopLineElement(LeftPts, 1) → PtAElement(RightPts, 1) → PtBPolygon(TLPoint, PtA, PtB, TRPoint) → q1, tlpoint, pta, ptb, trpointLaTeX("Points\text{:}") → PointTextLaTeX(x1) → x1TextLaTeX(x2) → x2TextLaTeX(x3) → x3TextLaTeX(x4) → x4TextLaTeX(x5) → x5TextLaTeX(x6) → x6TextLaTeX(y1) → y1TextLaTeX(y2) → y2TextLaTeX(y3) → y3TextLaTeX(y4) → y4TextLaTeX(y5) → y5TextLaTeX(y6) → y6TextLaTeX(Item1) → XColLabelLaTeX(Item2) → YColLabelRandom(1, 5) → qindexLaTeX("The\ correct\ answer\ is\ shown.\, See\ where\ you\\ made\ mistakes\ and\ try\ again.") → FBAnsShownLaTeX("Drag\ all\ the\ points\ onto\ the\ grid\ before\\ checking\ your\ work.") → FBNotStarted2LaTeX("Correct!") → FBCorrectLaTeX("One\ or\ more\ of\ the\ points\ is\ incorrect.\,\\Please\ try\ again.") → FBWrongLaTeX("Paired\ data\ was\ collected\ to\ study\ the\ effect\ of\ " + Item1lc + "\ on\ " + Item2lc + ".\\ Graph\ the\ data\ set.") → InstructionsQ2LaTeX("\textbf{Instructions\text{:}}\ First,\, drag\ the\ correct\ variable\ to\ the\ horizontal\ axis.") → Instructions2S1LaTeX("\textbf{Instructions\text{:}}\ Drag\ points\ onto\ the\ grid\ to\ graph\ the\ data\ set. ") → Instructions2S2LaTeX(("The\ \textbf{independent}\ variable\ affects\ the\\ dependent\ variable.\\ The\ \textbf{independent}\ variable\ goes\ on\\ the\ horizontal\ axis.\\This\ study\ looks\ at\ how\ " * Item1lc) + "\\ affects\ " + Item2lc + ".\\ Thus,\, " + Item1lc + "\ is\ the\\ independent\ variable.") → FeedbackQ2
AI 绘图提示语参考
绘制一个用于散点图练习的坐标平面。横轴和纵轴从原点出发,带有刻度标签。在网格区域内随机生成六个整数坐标点,并按顺序排列。在坐标平面下方放置两个可拖动的标签,分别写着“时间”和“金钱”,用于选择横轴变量。同时显示一段问题文本,询问哪个变量应放在横轴上。在图形右侧或下方添加一个反馈区域,包含对勾和叉号图标,以及提示文字,用于检查答案。整体布局清晰,适合学生交互操作。
以上提示语为根据原始绘图命令整理而来,仅供参考。