
房价估算数据统计分析
几何画板及绘图内容加载中,请稍等……
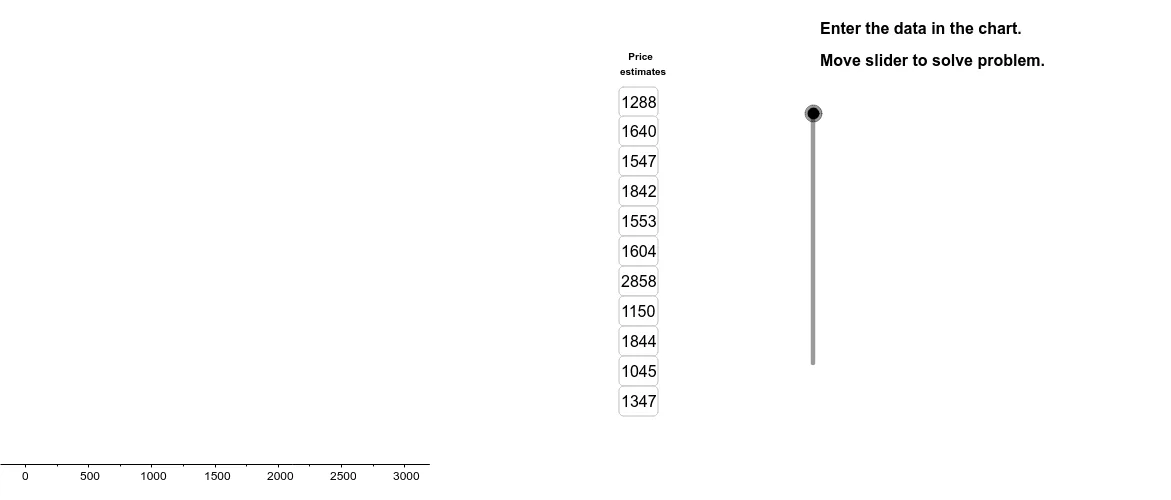
①本范例演示如何使用GeoGebra对房价估算数据进行统计分析,包括排序、绘制散点图、箱线图等;②涉及的核心数学概念有均值、中位数、四分位数、概率统计;③作图要点提炼自构造摘要,使用了Sort, DotPlot, Median, Q1, Q3, BoxPlot, Segment, Textfield, Element, RemoveUndefined, Join, Polygon, Mean, Length等命令和对象;④适合高中阶段学习概率统计和数据分析的学生使用。
GeoGebra 命令及参数
Sort(EstimateList) → SortedListDotPlot(SortedList) → DotPlotMedian(EstimateList) → ListMedQ1(EstimateList) → ListQ1Q3(EstimateList) → ListQ3BoxPlot(4, 1, EstimateList) → ListBoxSegment((ListMed, 0), (ListMed, 2.5)) → SegMedSegment((ListQ1, 0), (ListQ1, 2.5)) → SegQ1Segment((ListQ3, 0), (ListQ3, 2.5)) → SegQ3Segment((UpperLim, 0), (UpperLim, 2.5)) → SegUpperSegment((LowerLim, 0), (LowerLim, 2.5)) → SegLowerTextfield(A1) → InA1Textfield(A2) → InA2Textfield(A3) → InA3Textfield(A4) → InA4Textfield(A5) → InA5Textfield(A6) → InA6Textfield(A7) → InA7Textfield(A8) → InA8Textfield(A9) → InA9Textfield(A10) → InA10Textfield(A11) → InA11Element(SortedList, C1) → B1Element(SortedList, C2) → B2Element(SortedList, C3) → B3Element(SortedList, C4) → B4Element(SortedList, C5) → B5Element(SortedList, C6) → B6Element(SortedList, C7) → B7Element(SortedList, C8) → B8Element(SortedList, C9) → B9Element(SortedList, C10) → B10Element(SortedList, C11) → B11RemoveUndefined(Sequence[If[Element[SortedList, i] < LowerLim, Element[SortedList, i]], i, 1, 20]) → LowOutRemoveUndefined(Sequence[If[Element[SortedList, i] > UpperLim, Element[SortedList, i]], i, 1, 20]) → HighOutJoin({LowOut, HighOut}) → OutliersPolygon((3200, y(Corner[1])), Corner[2], Corner[3], (3200, y(Corner[4]))) → Mask, a, b, g, hMean(SortedList) → ListMeanLength(EstimateList) → ListLengthRemoveUndefined(Sequence[If[(Element[SortedList, i] > LowerLim) ∧ (Element[SortedList, i] < UpperLim), Element[SortedList, i]], i, 1, ListLength]) → GoodListLength(GoodList) → GoodLengthMean(GoodList) → GoodMeanElement(SortedList, 1) → ListLowElement(SortedList, ListLength) → ListHighElement(GoodList, 1) → GoodLowElement(GoodList, GoodLength) → GoodHighPolygon(A, B, C, D) → poly1, a_1, b_1, c, dPolygon(E, F, G, H) → poly2, e, f, g_1, h_1Polygon(I, J, K, L) → poly3, i, j, k, l
AI 绘图提示语参考
画一个统计分析图,展示房屋油漆工成本估算的数据。首先绘制一个点图显示所有估算值,然后添加中位数、第一四分位数和第三四分位数的三条水平线段。接着用箱线图表示数据分布,箱体覆盖四分位数范围,中线段表示中位数。最后,在箱线图两侧添加表示异常值的点,并在图表下方标注数据的基本统计量,如平均值、最大值、最小值等。
以上提示语为根据原始绘图命令整理而来,仅供参考。