
函数与体积关系的几何作图
几何画板及绘图内容加载中,请稍等……
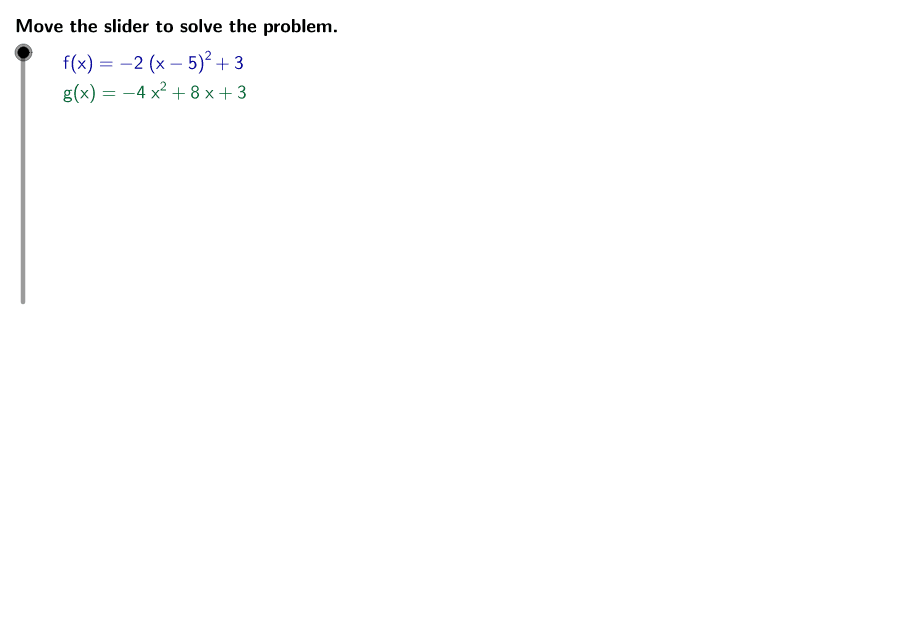
这个范例演示了两个函数 [math]f(x) = –2(x – 5)^{2} + 3[/math] 和 [math]g(x) = –4x^{2} + 8x + 3[/math] 如何分别表示两个长方体的体积。它涉及的核心数学概念包括函数、体积计算以及解析几何。通过使用 GeoGebra 命令如 LaTeX、Corner、If 和 TableText,可以动态展示函数图像及其对应的体积变化。适合高中数学教学,特别是解析几何和函数图像的教学。
GeoGebra 命令及参数
LaTeX(steps) → counterLaTeX("\text{Use the buttons below to return to the original problem or}\cr\text{randomly generate a similar practice problem.}") → RandomizationTextCorner(1) → ACorner(3) → BLaTeX("\text{Determine the coordinates of the maximum point of }\textcolor{#000099}{f(x)}.") → text1LaTeX("\text{To determine the coordinates of the maximum point of a function, first determine}\cr\text{the type of function and compare it to the standard form for that function.}") → text2LaTeX((("\text{The function }\textcolor{#000099}{f(x) = " * f) * "}\text{ is a quadratic function.}")) → text3If(ygmax > fc, LaTeX["\textcolor{#006633}{g(x)}\text{ is the function that}\cr\text{represents the greatest maximum volume for the associated rectangular solid}"], If[ygmax < fc, LaTeX["\textcolor{#000099}{f(x)}\text{ is the function that}\cr\text{represents the greatest maximum volume for the associated rectangular solid}"], LaTeX["\textcolor{#000099}{f(x)}\text{ and }\textcolor{#006633}{g(x)}\text{ represent}\cr\text{identical maximum volumes for their associated rectangular solids.}"]]) → winnerLaTeX((((((("\text{The function value of the maximum point of }\textcolor{#000099}{f(x)}\text{ is }\textcolor{#000099}{" * fc) * "}\text{, and the function value of}\cr\text{the maximum point of }\textcolor{#006633}{g(x)}\text{ is }\textcolor{#006633}{") * ygmax) * "}\text{. Therefore, }") * winner) * ".")) → text17LaTeX((("\text{The y-coordinate of the maximum point of }\textcolor{#006633}{g(x)}\text{ is }\textcolor{#006633}{" * ygmax) * "}.")) → text14LaTeX((((("\text{The maximum point of }\textcolor{#006633}{g(x)}\text{ is }\textcolor{#006633}{(" * xgmax) * ", ") * ygmax) * ")}.")) → text15LaTeX("\text{Determine the coordinates of the maximum point of }\textcolor{#006633}{g(x)}.") → text6LaTeX((("\text{The x-coordinate of the maximum point of }\textcolor{#006633}{g(x)}\text{ is }\textcolor{#006633}{" * xgmax) * "}.")) → text11LaTeX((("\text{Since }\textcolor{#006633}{a=" * ga) * "}\text{ is less than 0, }\textcolor{#006633}{g(x)}\text{ will have a maximum.}")) → text9LaTeX("\text{To determine the y-coordinate of the maximum, substitute the value of }\textcolor{#006633}{x}\text{ into the function }\textcolor{#006633}{g(x)}.") → text12TableText({{LaTeX[(("\textcolor{#006633}{g(x)=" * g) * "}")], LaTeX["\text{Given function}"]}, {LaTeX[(((((((((((("\textcolor{#006633}{g(" * xgmax) * ")=") * ga) * "(") * xgmax) * ")^2+(") * gb) * ")(") * xgmax) * ")+(") * gc) * ")}")], LaTeX[(("\text{Substitute }\textcolor{#006633}{" * xgmax) * "}\text{ for }\textcolor{#006633}{x}.")]}, {LaTeX[(((("\textcolor{#006633}{g(" * xgmax) * ")=") * ygmax) * "}")], LaTeX["\text{Simplify.}"]}}) → text13LaTeX("\text{Determine which function models the greatest maximum volume of its associated rectangular solid.}") → text16LaTeX("\text{Move the slider to solve the problem.}") → text0LaTeX("\text{The vertex form for a quadratic function is }\textcolor{#000099}{f(x) = a(x – h)^2 + k}\text{, where the}\cr\text{coordinates of the maximum }\textcolor{#000099}{(a < 0)}\text{ or minimum }\textcolor{#000099}{(a > 0)}\text{ function value are }\textcolor{#000099}{(h, k)}.") → text4LaTeX((((((((((((("\text{Since }\textcolor{#000099}{f(x) =" * f) * "}\text{ is already written in vertex form, it can be seen that for }\cr\textcolor{#000099}{f(x)}\text{, }\textcolor{#000099}{h=") * fb) * "}\text{, }\textcolor{#000099}{k=") * fc) * "}\text{, and }\textcolor{#000099}{a=") * fa) * "}\text{, which is less than 0; therefore, the maximum point of }\textcolor{#000099}{f(x)}\cr\text{is located at }\textcolor{#000099}{(") * fb) * ", ") * fc) * ")}.")) → text5LaTeX((((("\textcolor{#000099}{f(x)=" * f) * "}\cr\textcolor{#006633}{g(x)=") * g) * "}")) → ProblemLaTeX((((((((("\text{The function }\textcolor{#006633}{g(x) = " * g) * "}\text{ is also a quadratic function, but it is written}\cr\text{in standard form, }\textcolor{#006633}{f(x)=ax^2 +bx+c}\text{, where }\textcolor{#006633}{a=") * ga) * "}\text{, }\textcolor{#006633}{b=") * gb) * "}\text{, and }\textcolor{#006633}{c=") * gc) * "}.")) → text7LaTeX("\text{Recall that the x-coordinate of the maximum or minimum of a quadratic in this}\cr\text{form is }\textcolor{#006633}{x=-\frac{b}{2a}}\text{, which is a maximum if }\textcolor{#006633}{a<0}.") → text8TableText({{LaTeX["\textcolor{#006633}{x=-\frac{b}{2a}}"], LaTeX["\text{Formula for the x-coordinate}"]}, {LaTeX[(((("\textcolor{#006633}{x=-\frac{(" * gb) * ")}{2(") * ga) * ")}}")], LaTeX[(((("\text{Substitute }\textcolor{#006633}{" * gb) * "}\text{ for }\textcolor{#006633}{b}\text{ and }\textcolor{#006633}{") * ga) * "}\text{ for }\textcolor{#006633}{a}.")]}, {LaTeX[(((("\textcolor{#006633}{x=-\frac{" * gb) * "}{") * twoa) * "}}")], LaTeX["\text{Simplify.}"]}, {LaTeX[(("\textcolor{#006633}{x=" * xgmax) * "}")], LaTeX["\text{Simplify.}"]}}) → text10
AI 绘图提示语参考
绘制两个二次函数f(x) = –2(x – 5)² + 3和g(x) = –4x² + 8x + 3的图像,确定它们的最大值点,并比较哪个函数代表更大的体积。首先绘制f(x),找到其顶点坐标(5, 3),然后绘制g(x),计算其顶点x坐标为2,代入得到顶点y坐标为7。最后比较两个函数的最大值,确定哪个函数代表更大的体积。
以上提示语为根据原始绘图命令整理而来,仅供参考。