
GeoGebra 汽油里程估算示例
几何画板及绘图内容加载中,请稍等……
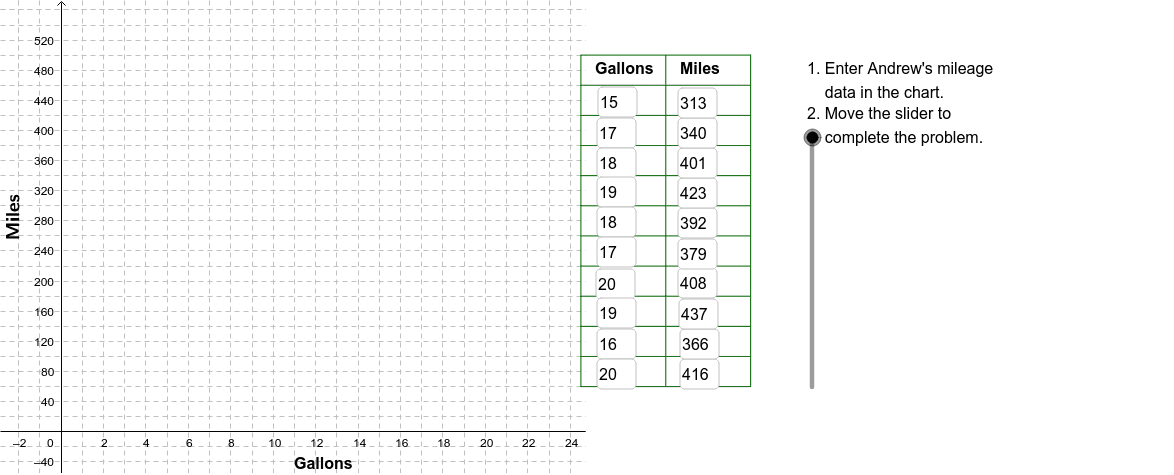
①本范例演示了如何使用 GeoGebra 计算和可视化汽油里程(每加仑行驶的英里数);②涉及的核心数学概念包括加法、均值、函数和复数;③作图要点:使用了 Corner, Polygon, Textfield, Sequence, Point, Line, VerticalText 等命令和对象来创建和展示数据;④适合高中数学学生用于学习数据分析和函数建模。
GeoGebra 命令及参数
Corner(2) → Corn2Corner(3) → Corn3Polygon(Corn1, Corn2, Corn3, Corn4) → poly1, corn1, corn2, corn3, corn4Textfield(A2) → InA2Textfield(A3) → InA3Textfield(A4) → InA4Textfield(A5) → InA5Textfield(A6) → InA6Textfield(A7) → InA7Textfield(A8) → InA8Textfield(A9) → InA9Textfield(A10) → InA10Textfield(A11) → InA11Textfield(B11) → InB11Textfield(B10) → InB10Textfield(B9) → InB9Textfield(B8) → InB8Textfield(B7) → InB7Textfield(B6) → InB6Textfield(B5) → InB5Textfield(B4) → InB4Textfield(B3) → InB3Textfield(B2) → InB2Sequence(Segment[(24.5, 60 + 40 * j), (32.5, 60 + 40 * j)], j, 0, 11) → LnListSequence(Segment[(24.5 + 4 * j, 60), (24.5 + 4 * j, 500)], j, 0, 2) → LnList2Point(a) → mpg10Line((0, 0), mpg10) → Lmpg10Line((0, 0), mpg22) → Lmpg22VerticalText("Miles") → LabelMiles
AI 绘图提示语参考
绘制一个表示汽车油耗的图表,包括四个角点形成一个四边形,以及两条从原点出发的线段表示不同油耗情况。添加垂直标签显示里程。输入字段用于输入数据,生成一系列平行线段表示里程刻度。
以上提示语为根据原始绘图命令整理而来,仅供参考。