
函数平移变换示例
几何画板及绘图内容加载中,请稍等……
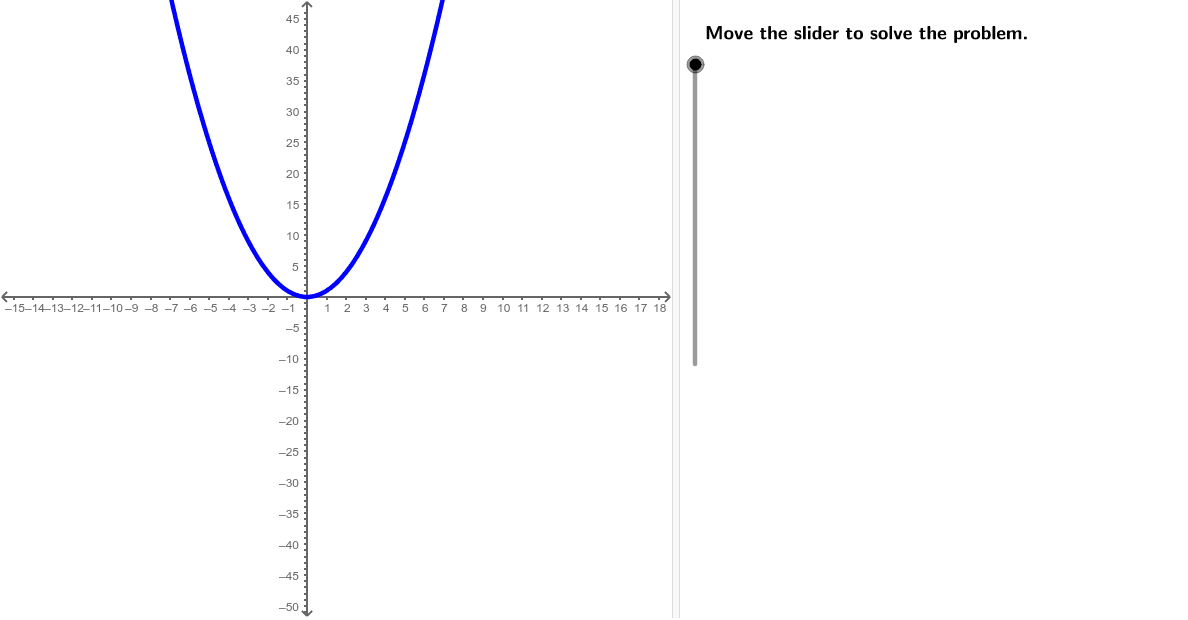
①本范例演示了函数f(x)=x^2的图像在水平方向上平移k个单位后的变化规律;②涉及的核心数学概念包括函数图像平移、自变量变换f(x+k);③作图要点——从下方『构造摘要』提炼用到了Point, Line, Sequence, If, Textfield, TableText等GeoGebra命令/对象;④适合高中数学学生学习和理解函数图像变换的性质。
GeoGebra 命令及参数
Point(xAxis) → FPoint(xAxis) → APoint(xAxis) → BPoint(xAxis) → CPoint(xAxis) → DPoint(xAxis) → ELine((x(Corner[1]) + ((2 * indent) * screenwidth), 0), yAxis) → align1Line((x(Corner[1]) + ((3 * indent) * screenwidth), 0), yAxis) → align2Line((x(Corner[1]) + ((4 * indent) * screenwidth), 0), yAxis) → align3Sequence(p(Element[xValues, i]), i, 1, Length[xValues]) → pValuesSequence(f(Element[xValues, i]), i, 1, Length[xValues]) → fValuesSequence((Element[xValues, i], Element[fValues, i]), i, 1, Length[xValues]) → fPointsSequence((Element[xValues, i], Element[pValues, i]), i, 1, Length[xValues]) → pPointsIf(k ≥ 0, "+", "") → showsignIf(k ≥ 0, "left", "right") → directionTextfield(f) → inputBox1TableText({{A1, B1, C1, D1, E1, F1}, {A2, B2, C2, D2, E2, F2}, {A3, B3, C3, D3, E3, F3}}, "|_") → tabletext
AI 绘图提示语参考
画一个函数图像平移的示例,展示函数f(x)=x^2在水平方向上平移k个单位后的图像变化。首先绘制x轴上的几个点,然后通过这些点创建三条平行线,接着用序列生成函数f(x)和p(x+k)的值,并将这些值对应的点连接起来,最后在图像旁边标注函数名称和平移方向等信息。
以上提示语为根据原始绘图命令整理而来,仅供参考。