
Jameson开车速度与距离关系示例
几何画板及绘图内容加载中,请稍等……
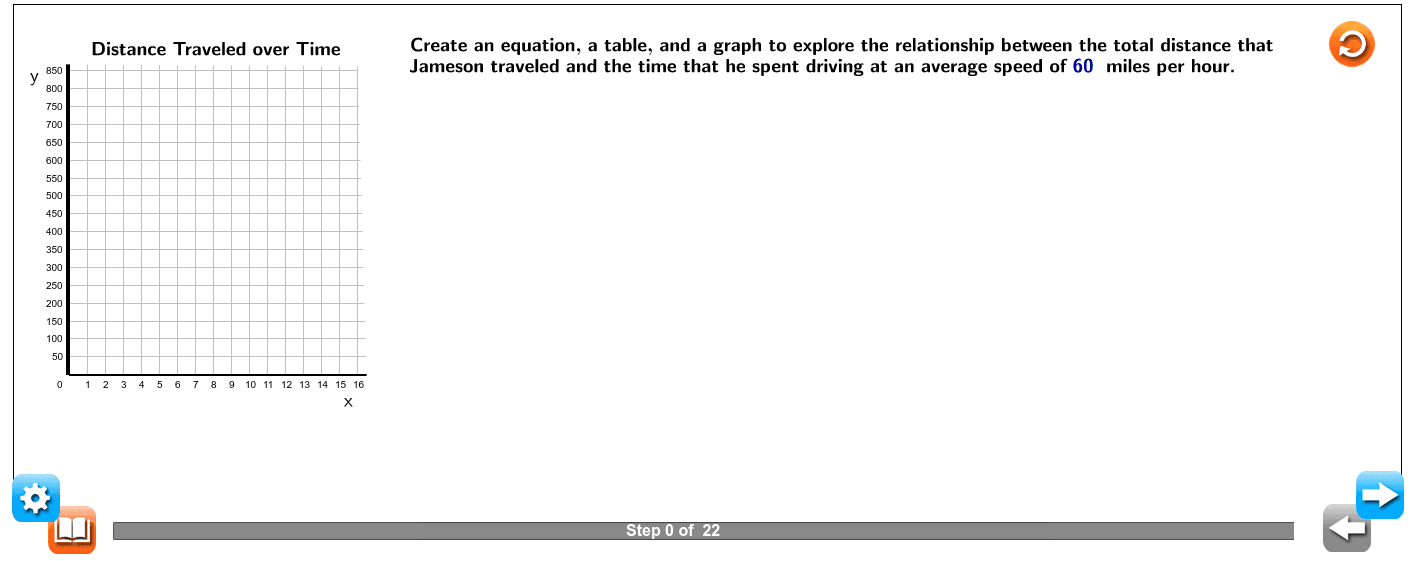
本范例演示了在固定平均速度下,总行驶距离与时间的关系。核心数学概念包括线性函数、比例关系和变量表示。作图要点涉及使用GeoGebra命令如Segment、Midpoint、Point、Polygon和FitLineY来构建距离与时间的图形关系。适合初中或高中数学学习,用于理解函数图像和实际应用。
GeoGebra 命令及参数
LaTeX("\text{Identify the independent and dependent quantities.}") → Text1_1LaTeX((("\text{\textcolor{#000099}{d}=\textcolor{#000099}{" * d0) * "}}")) → Text4_{12}LaTeX((("\text{\textcolor{#000099}{d}=\textcolor{#000099}{" * d1) * "}}")) → Text4_{17}Segment(F, E) → iSegment(E, G) → jSegment(G, H) → kSegment(F, H) → lMidpoint(i) → IMidpoint(k) → KPoint(j) → JPoint(l) → LPoint(j) → MPoint(l) → NPoint(j) → OPoint(l) → PPoint(j) → QPoint(l) → RPoint(j) → SPoint(l) → TPoint(j) → UPoint(l) → VPolygon(A_1, B_1, C_1, D_1) → poly1, a_1, b_1, c_1, d_1Sequence(Segment[(19, 490 + (80 * i)), (34, 490 + (80 * i))], i, 0, 6) → LinesHoriSegment(A6, F6) → aLaTeX("\text{Use the buttons below to return to the original problem or}") → Check_1LaTeX("\text{randomly generate a similar practice problem. }") → Check_2FitLineY({E6, D6}) → bIntersect(b, yAxis) → E_1Segment(G_1, H_1) → c_2Segment(G_1, I_1) → dSegment(H_1, J_1) → eSegment(I_1, J_1) → fPoint(d) → K_1Point(e) → L_1Point(d) → M_1Point(e) → N_1Point(d) → O_1Point(e) → P_1Point(d) → Q_1Point(e) → R_1Point(d) → S_1Point(e) → T_1Point(c_2) → Z_1Point(f) → A_2VerticalText("\text{Total distance in miles \textcolor{#000099}{(d)}") → text2LaTeX("{x}") → text1LaTeX("{y}") → text1_1LaTeX("\text{Distance Traveled over Time}") → text1_3FitLineY({A6, E_1}) → tFitLineY({A6, E_1}) → e_1FitLineY({A6, E_1}) → f_1FitLineY({A6, E_1}) → g_1FitLineY({A6, E_1}) → h_1FitLineY({A6, E_1}) → j_1FitLineY({B6, F6}) → sPoint(yAxis) → F_1OrthogonalLine(F_1, s) → i_1Intersect(s, i_1) → E_2Intersect(s, yAxis) → F_2Vector(F_2, E_2) → uLaTeX("\text{the total distance also increases.}") → Text4_{21}Point(d) → U_1Point(e) → V_1LaTeX((((("\text{The values in the second row will be \textcolor{#000099}{" * val1) * "} and \textcolor{#000099}{") * d1) * "}.}")) → Text4_{18}LaTeX("\text{Time in hours \textcolor{#000099}{(t)}") → text1_2LaTeX("\text{Choose variables to represent the independent and dependent quantities.}") → Text2_1LaTeX("\text{Create an equation, a table, and a graph to explore the relationship between the total distance that }") → Question1LaTeX("\text{traveled depends on the time in hours that he spent driving.}") → Text1_3LaTeX("\text{Since “distance” starts with the letter “\textcolor{#000099}{d},” let the distance be represented by the variable \textcolor{#000099}{d}.}") → Text2_3LaTeX("\text{Write an equation to represent the relationship between the independent and dependent variables.}") → Text3_1LaTeX("\text{by the time in hours \textcolor{#000099} {(t)} that he spent driving.}") → Text3_4LaTeX("\text{Create a table of values to represent the relationship between the independent and dependent variables. }") → Text4_1LaTeX("\text{Use the table to create a graph that represents the relationship between the independent and dependent variables. }") → Text5_1LaTeX("\text{plane to represent the relationship.}") → Text5_{13}LaTeX("\text{Each row in the table of values provides a coordinate point that can be graphed on the coordinate }") → Text5_{12}LaTeX("\text{coordinate points to show how the total distance traveled was constantly changing.}") → Text5_{19}LaTeX("\text{This graph shows that as the time }") → Text5_{25}LaTeX("\text{shown in the table of values.}") → Text5_2Polygon(A_3, G_2, J_2, K_2) → poly2, a_2, g_2, j_2, k_2TableText({{"Time \;in\; hours \;\textcolor{#000099}{(t)}", LaTeX[(("\text{ \textcolor{#000099}{" * val0) * "} }")], LaTeX[(("\text{ \textcolor{#000099}{" * val1) * "} }")], LaTeX[(("\text{ \textcolor{#000099}{" * val2) * "} }")], LaTeX[(("\text{ \textcolor{#000099}{" * val3) * "} }")], LaTeX[(("\text{\textcolor{#000099}{ " * val4) * "} }")], LaTeX[(("\text{ \textcolor{#000099}{" * val5) * "} }")]}, {"Total\; distance\; in\; miles \;\textcolor{#000099}{(d)}", LaTeX[(("\text{\textcolor{#000099}{ " * d0) * "} }")], LaTeX[(("\text{ \textcolor{#000099}{" * d1) * "} }")], LaTeX[(("\text{ \textcolor{#000099}{" * d2) * "} }")], LaTeX[(("\text{\textcolor{#000099}{ " * d3) * "} }")], LaTeX[(("\text{\textcolor{#000099}{" * d4) * "} }")], LaTeX[(("\text{\textcolor{#000099}{ " * d5) * "} }")]}}, "hc|_") → text3LaTeX((("\text{Jameson traveled and the time that he spent driving at an average speed of \textcolor{#000099}{" * miles1) * " } miles per hour. }")) → Question1_2LaTeX((("\text{Miles per hour=" * miles1) * "}")) → text5LaTeX("\text{Since “time” starts with the letter “\textcolor{#000099}{t},” let the time be represented by the variable \textcolor{#000099}{t}.}") → Text2_2LaTeX("\text{Since Jameson drove at a constant rate of speed,and since it is possible for Jameson to drive for a fractional }") → Text5_{21}LaTeX("\text{The title of the graph can be “Distance Traveled over Time.” }") → Text5_5LaTeX((("\text{The distance in miles \textcolor{#000099}{(d)} that Jameson traveled is calculated by multiplying his rate (\textcolor{#000099}{" * miles1) * "} miles per hour) }")) → Text3_3LaTeX((("\text{\textcolor{#000099}{d}=\textcolor{#000099}{" * miles1) * "t}}")) → Text4_{10}LaTeX((((("\text{\textcolor{#000099}{d}=\textcolor{#000099}{" * miles1) * "( ") * val0) * ")}}")) → Text4_{11}LaTeX((((("\text{\textcolor{#000099}{d}=\textcolor{#000099}{" * miles1) * "( ") * val1) * ")}}")) → Text4_{16}LaTeX((("\text{Jameson drove his car at \textcolor{#000099}{" * miles1) * "} miles per hour, which means that the total distance in miles that Jameson }")) → Text1_2LaTeX("\text{Therefore, the time is the independent quantity, and the distance is the dependent quantity.}") → Text1_4LaTeX((("\text{Therefore, the relationship can be represented by the equation \textcolor{#000099}{d}=\textcolor{#000099}{" * miles1) * "t}.}")) → Text3_5LaTeX("\text{Use one row of the table for the values of the independent variable, the time in hours \textcolor{#000099}{(t)}.}") → Text4_2LaTeX("\text{Use the other row of the table for the values of the dependent variable, the total distance in miles \textcolor{#000099}{(d)}.}") → Text4_5LaTeX((("\text{To fill in the table, choose values for \textcolor{#000099}{t} to substitute into the equation \textcolor{#000099}{d}=\textcolor{#000099}{" * miles1) * "t}. Let’s start with \textcolor{#000099}{0}.}")) → Text4_7LaTeX((("\text{For the first row of the table, let \textcolor{#000099}{t=" * val0) * "}:}")) → Text4_9LaTeX((((("\text{So, the values in the first row will be \textcolor{#000099}{" * val0) * "} and \textcolor{#000099}{") * d0) * "}.}")) → Text4_{13}LaTeX((("\text{For the second row of the table, let \textcolor{#000099}{t=" * val1) * "}:}")) → Text4_{14}LaTeX("\text{Continue with other values of \textcolor{#000099}{t}, as shown.}") → Text4_{20}LaTeX("\text{Based on the table, as the time increases,}") → Text4_{15}LaTeX("\text{The independent quantity, the time in hours \textcolor{#000099}{(t)}, is plotted along the \textcolor{#000099}{x}-axis of the coordinate plane. }") → Text5_3LaTeX("\text{The dependent quantity, the total distance in miles \textcolor{#000099}{(d)}, is plotted along the \textcolor{#000099}{y}-axis. }") → Text5_4LaTeX((("\text{Since it is not possible to have a negative amount of time, the \textcolor{#000099}{x}-axis starts at \textcolor{#000099}{" * val0) * "}. Since it is not possible to}")) → Text5_6LaTeX((("\text{travel a negative distance, the \textcolor{#000099}{y}-axis also starts at \textcolor{#000099}{" * val0) * "}.}")) → Text5_8LaTeX("\text{number of hours (such as \textcolor{#000099}{2.5} hours) instead of only a whole number of hours, draw a line through the}") → Text5_{23}LaTeX("\text{increases, the total distance traveled also }") → Text5_{26}LaTeX("\text{increases. This confirms the relationship }") → Text5_{27}LaTeX("\text{\textbf{dependent variable}\;labeled on the y-axis; the quantity that is based on the}") → text6_2LaTeX("\text{\textbf{independent variable}\;labeled on the x-axis; the quantity that changes based}") → text6LaTeX("\text{input values of the independent variable; the output variable of a function}") → text6_3LaTeX("\text{on values chosen; the input variable of a function}") → text6_1
AI 绘图提示语参考
画一个展示距离和时间关系的图形,包含一条直线表示恒定速度下的距离随时间变化,用点和线段构建一个多边形,并添加标注说明独立和依赖变量,以及距离和时间单位,最后用一条拟合线穿过数据点展示线性关系。
以上提示语为根据原始绘图命令整理而来,仅供参考。