
动态箱线图v2.1
几何画板及绘图内容加载中,请稍等……
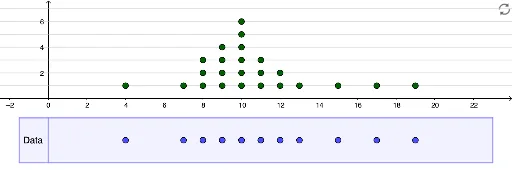
①本范例演示动态箱线图的绘制与交互变化;②涉及核心数学概念包括箱线图、数据分布、中位数、四分位数、概率统计;③构造要点:使用Sequence, Point, DotPlot, Histogram, Polygon, Intersect, Segment, BoxPlot等GeoGebra命令绘制和计算;④适合高中及以上学生及数学爱好者用于数据可视化教学与探索。
GeoGebra 命令及参数
Sequence((j, -3.25), j, 1, 22) → L_4Point(L_4) → ZPoint(L_4) → WPoint(L_4) → VPoint(L_4) → UPoint(L_4) → TPoint(L_4) → SPoint(L_4) → RPoint(L_4) → QPoint(L_4) → PPoint(L_4) → OPoint(L_4) → NPoint(L_4) → MPoint(L_4) → LPoint(L_4) → KPoint(L_4) → JPoint(L_4) → IPoint(L_4) → HPoint(L_4) → GPoint(L_4) → FPoint(L_4) → EPoint(L_4) → DPoint(L_4) → APoint(L_4) → BPoint(L_4) → CDotPlot(L_1) → L_2Sequence(-10, 25, 1) → L_5Histogram(L_5, L_1, false) → bSequence(1, 10, 1) → L_3Polygon(A_1, B_1, C_1, D_1) → q1, a_1, b_1, c_1, d_1Intersect(d_1, yAxis) → E_1Intersect(yAxis, b_1) → F_1Segment(E_1, F_1) → fSequence(y = j_1, j_1, 1, 10) → L_6BoxPlot(boxplotoffset, 1, L_1) → a