
函数奇偶性判定示例
几何画板及绘图内容加载中,请稍等……
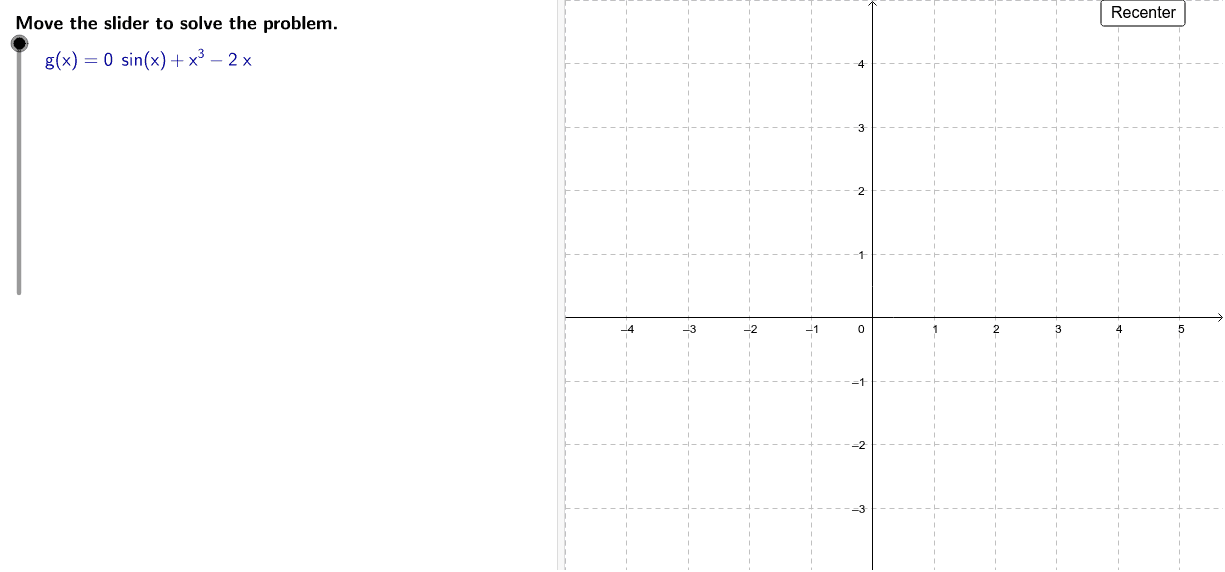
①本范例通过绘制函数 g(x) = x³ – 2x 的图像来演示如何判断函数的奇偶性;②涉及的核心数学概念包括函数图像、奇函数(f(-x) = f(x))和偶函数(f(-x) = -f(x));③作图要点使用了 GeoGebra 命令如 LaTeX, Corner, Point;对象包括 b, a, d, c, stepMax, stepper, steps, counter, text0, Original, Randomize, Recenter, scale, xmax, xmin, ymax, ymin, FixTextWindow, A, B, txmin, txmax, tymin, g, tymax, text1, text2, C, text3, D, text4, text5, text6, RandomizationText, Problem;④适合高中阶段学习函数性质的学生使用。
GeoGebra 命令及参数
LaTeX(steps) → counterLaTeX("\text{Move the slider to solve the problem.}") → text0Corner(1) → ACorner(3) → BLaTeX("\text{Graph the function.}") → text1LaTeX("\text{Visually compare the parts of the graph to the right}\cr\text{and left of the y-axis.}") → text2Point(g) → CLaTeX("\text{Drag the }\textcolor{#CC0000}{\text{red point}}\text{ along the graph and compare}\cr\text{its coordinates to those of the gray point.}") → text3LaTeX("\text{Notice that opposite values of x result in}\cr\text{opposite values of y.}") → text4LaTeX("\text{Summarize your findings.}") → text5LaTeX("\text{The function }\textcolor{#000099}{g(x)}\text{ is an odd function since it can}\cr\text{be seen from the graph that }\textcolor{#000099}{g(x) = –g(–x)}.") → text6LaTeX("\text{Use the buttons below to return to the original problem or}\cr\text{randomly generate a similar practice problem.}") → RandomizationTextLaTeX((("\textcolor{#000099}{g(x)=" * g) * "}")) → Problem
AI 绘图提示语参考
画一个函数 g(x) = x³ – 2x 的图像,并展示如何通过图像判断其奇偶性。首先绘制函数图像,然后标记原点并添加一个可拖动的点,使其在图像上移动。同时,在右侧和左侧 y 轴附近添加文本说明,引导观察者比较图像的对称性。通过拖动红点,观察其坐标与原点附近灰点的对称关系,并添加文本解释相反 x 值对应相反 y 值的现象。最后总结函数为奇函数,并说明理由。
以上提示语为根据原始绘图命令整理而来,仅供参考。