
绘制扇形图
几何画板及绘图内容加载中,请稍等……
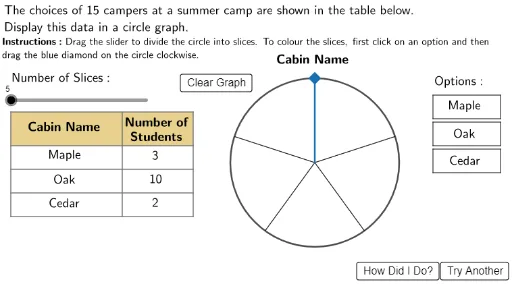
这个范例演示了如何通过拖动点来创建扇形图。它涉及圆、扇形和百分比等核心数学概念。通过使用GeoGebra命令如Circle、CircleSector等,可以直观地展示数据分布情况。适合初中及以上学生学习数据统计和图形绘制。
GeoGebra 命令及参数
Circle(Centre, circrad) → CircPoint(Circ) → P25Point(Circ) → P24Point(Circ) → P23Point(Circ) → P22Point(Circ) → P21Point(Circ) → P20Point(Circ) → P19Point(Circ) → P18Point(Circ) → P17Point(Circ) → P16Point(Circ) → P15Point(Circ) → P14Point(Circ) → P13Point(Circ) → P12Point(Circ) → P11Point(Circ) → P10Point(Circ) → P9Point(Circ) → P8Point(Circ) → P7Point(Circ) → P6Point(Circ) → P5Point(Circ) → P4Point(Circ) → P3Point(Circ) → P2Point(Circ) → P1Segment((0, 4.5), (5.4, 4.5)) → h1Segment((0, 3.5), (5.4, 3.5)) → h2Segment((0, 2.8), (5.4, 2.8)) → h3Segment((0, 2.1), (5.4, 2.1)) → h4Segment((0, 1.4), (5.4, 1.4)) → h5Segment((0, 4.5), (0, 1.4)) → v1Segment((3.3, 4.5), (3.3, 1.4)) → v2Segment((5.4, 4.5), (5.4, 1.4)) → v3Segment(Centre, P1) → Slice1Segment(Centre, P2) → Slice2Segment(Centre, P3) → Slice3Segment(Centre, P4) → Slice4Segment(Centre, P5) → Slice5Segment(Centre, P6) → Slice6Segment(Centre, P7) → Slice7Segment(Centre, P8) → Slice8Segment(Centre, P9) → Slice9Segment(Centre, P10) → Slice10Segment(Centre, P11) → Slice11Segment(Centre, P12) → Slice12Segment(Centre, P13) → Slice13Segment(Centre, P14) → Slice14Segment(Centre, P15) → Slice15Segment(Centre, P16) → Slice16Segment(Centre, P17) → Slice17Segment(Centre, P18) → Slice18Segment(Centre, P19) → Slice19Segment(Centre, P20) → Slice20Segment(Centre, P21) → Slice21Segment(Centre, P22) → Slice22Segment(Centre, P23) → Slice23Segment(Centre, P24) → Slice24Point(AllPoints) → R1Segment(Centre, P25) → Slice25Segment(Centre, R1) → R1SweepPolygon((12.5, 2.7), (14.5, 2.7), (14.5, 3.4), (12.5, 3.4)) → Option3Box, n, p, q, rPolygon((12.5, 5), (14.5, 5), (14.5, 4.3), (12.5, 4.3)) → Option1Box, f, g, h, iPolygon((12.5, 3.5), (14.5, 3.5), (14.5, 4.2), (12.5, 4.2)) → Option2Box, j, k, l, mCircleSector(Centre, R1, P1) → Section1Point(R2PointSpace) → R2Point(R3PointSpace) → R3Segment(Centre, R2) → R2SweepSegment(Centre, R3) → R3SweepCircleSector(Centre, R2, R1) → Section2CircleSector(Centre, R3, R2) → Section3Circle(Centre, (2 * circrad / 3)) → InnerCirc
AI 绘图提示语参考
画一个圆形,并在圆内均匀分布25个点,从圆心向外依次连接每个点到圆周,形成扇形区域,同时绘制水平线和垂直线构成坐标轴,展示数据分布的扇形图。
以上提示语为根据原始绘图命令整理而来,仅供参考。