
创建散点图 by cemccourseware
几何画板及绘图内容加载中,请稍等……
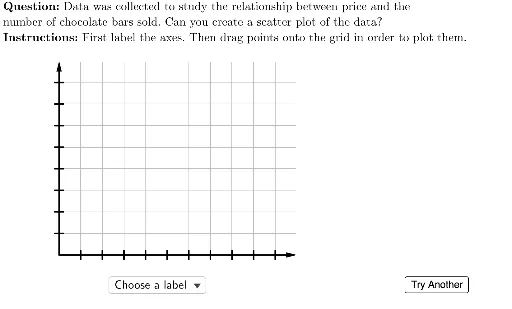
本范例演示如何使用GeoGebra创建散点图。涉及的核心数学概念包括算术平均数、三角函数和极限。通过使用Flatten、Point、Element等命令,可以构造出散点图。适合高中数学教学和学习。
GeoGebra 命令及参数
Flatten(Sequence[Sequence[(i, j), i, 0, 10, 1], j, 0, 8, 1]) → gridSpacePoint(Union[gridSpace, {homeBase}]) → EPoint(Union[gridSpace, {homeBase}]) → DPoint(Union[gridSpace, {homeBase}]) → CPoint(Union[gridSpace, {homeBase}]) → BElement(questionList, questionListIndex) → questionNumElement(H2:H6, questionNum) → yIncPoint(Union[gridSpace, {homeBase}]) → FElement(G2:G6, questionNum) → xIncElement(F2:F6, questionNum) → yValsElement(E2:E6, questionNum) → xValsElement(D2:D6, questionNum) → depVarWordsElement(C2:C6, questionNum) → indepVarWordsUnicodeToLetter(10007) → xmarkUnicodeToLetter(10003) → cmarkPoint(Union[gridSpace, {homeBase}]) → AZip((A / xInc, B / yInc), A, xVals, B, yVals) → correctPointsLaTeX((((("\text{" * QUESTION) * "\\") * INSTRUCTIONS) * "}")) → TEXTElement(B2:B6, questionNum) → dependentVariableElement(A2:A6, questionNum) → independentVariableVector((0, 0), (0, 9)) → yAxisLineVector((0, 0), (11, 0)) → xAxisLineSequence(Segment[(-0.2, i), (0.2, i)], i, 1, 8) → yTicksSequence(Segment[(i, -0.2), (i, 0.2)], i, 1, 10) → xTicksSequence(i, i, xInc, (10 * xInc), xInc) → xTickLabelsSequence(i, i, yInc, (10 * yInc), yInc) → yTickLabelsSequence(Text[Element[xTickLabels, i], (i - 0.2, -0.7)], i, 1, 10) → xAxisTickLabelsSequence(Text[Element[yTickLabels, i], (-1, i - 0.2)], i, 1, 8) → yAxisTickLabelsPolygon({(0, 0), (0, 9), (11, 9), (11, 0)}) → viewBoxTableText({Join[{{(("\cellcolor{#ffcc80}{" * independentVariable) * "}")}, xVals}], Join[{{(("\cellcolor{#ffcc80}{" * dependentVariable) * "}")}, yVals}]}, "|_vc") → dataZip(Circle[A, 0.3], A, correctPoints) → correctCirclesLaTeX("\text{Points to Plot:}") → pointsLabelJoin({{LaTeX["\text{Choose a label}"]}, Shuffle[{dependentVariable, independentVariable}]}) → axesLabelsSelectedElement(axesLabels) → selectedLabelRotateText(If[selectedLabel ≟ independentVariable, dependentVariable, If[selectedLabel ≟ dependentVariable, independentVariable, ""]], 90°) → otherLabelLaTeX((((((("\text{Since the " * indepVarWords) * " may cause\\the ") * depVarWords) * "\\to change, ") * indepVarWords) * " is the\\independent variable which is\\placed on the horizontal axis.}")) → feedbackLabels
AI 绘图提示语参考
画一个散点图,包含一个坐标网格和多个点。网格由水平和垂直线段组成,并带有刻度标记和标签。点根据给定的 x 和 y 值分布在图上,部分点用圆圈突出显示。图还包含坐标轴、标题和说明文字,解释变量关系和绘图目的。
以上提示语为根据原始绘图命令整理而来,仅供参考。