
Contour Plot 绘图指南
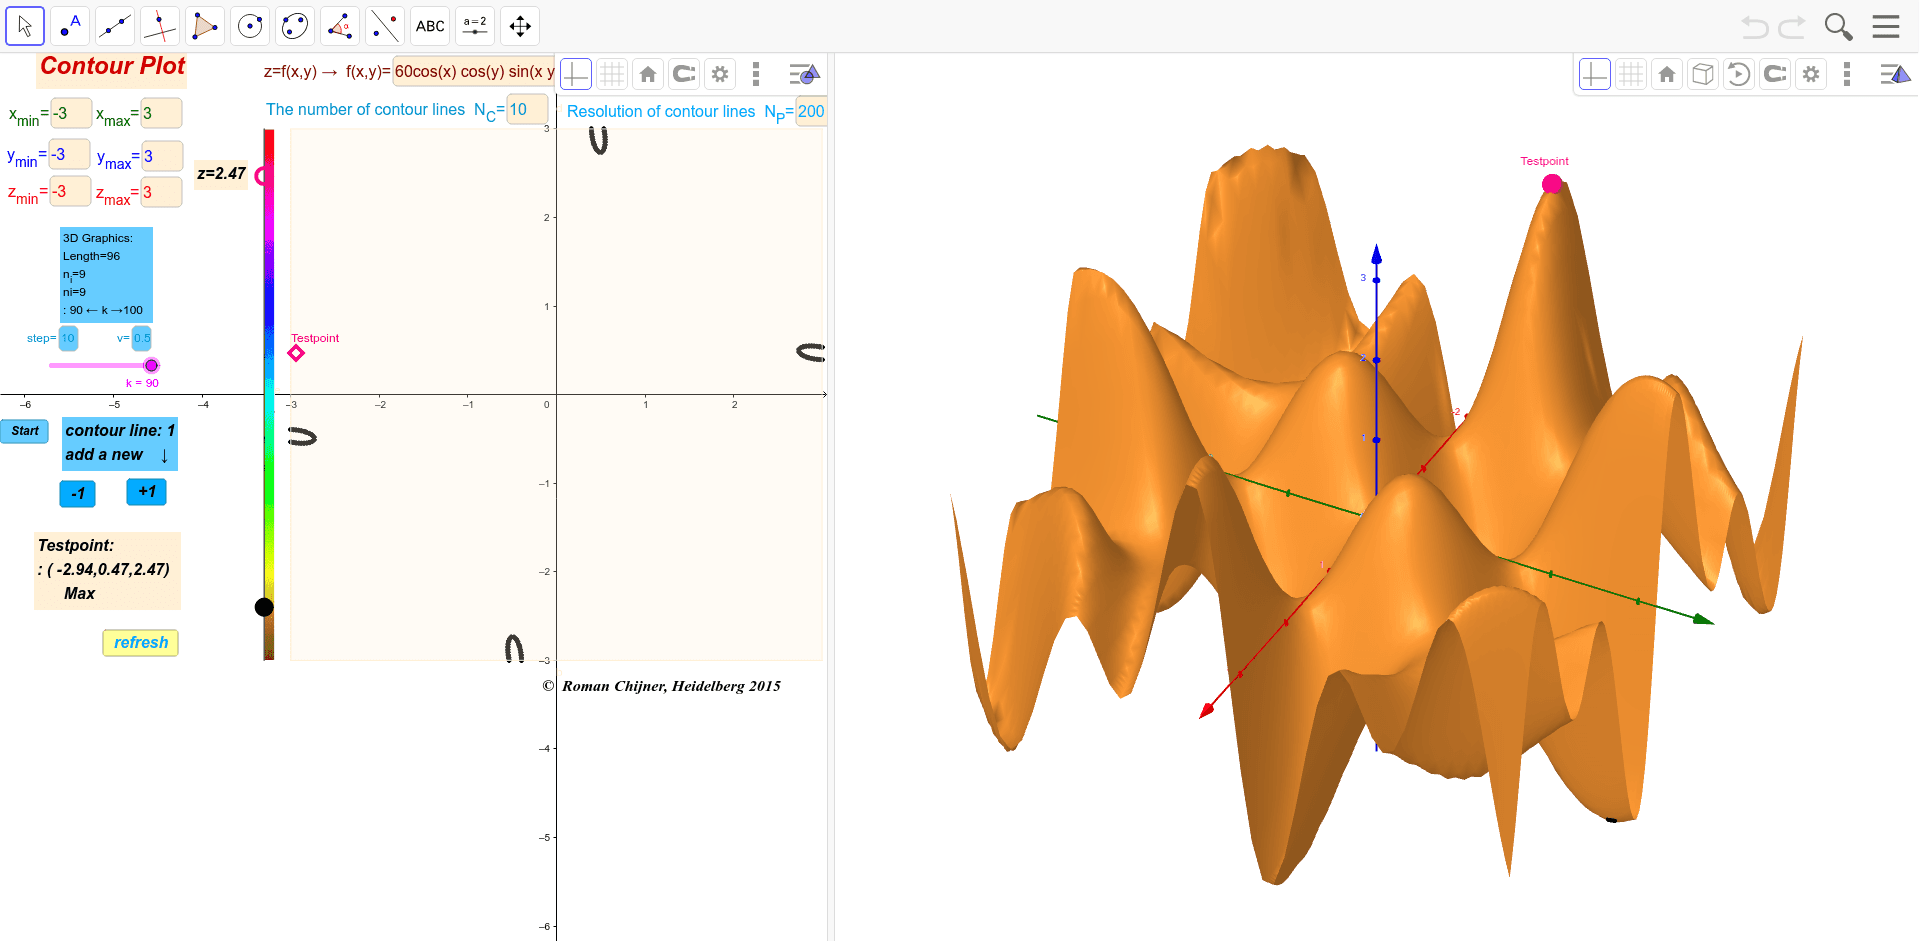
几何画板及绘图内容加载中,请稍等……
Contour Plot 演示如何绘制任意函数 z=f(x,y) 的等高线图。核心数学概念包括函数图像、等高线与坐标系。作图要点涉及使用 GeoGebra 命令如 Polygon、Segment、RemoveUndefined 等对象。适合高中生或大学低年级学生用于学习函数图像与空间几何。
GeoGebra 命令及参数
Polygon((x_{min}, y_{min}), (x_{max}, y_{min}), (x_{max}, y_{max}), (x_{min}, y_{max})) → poly1, b, c, d, eSegment(B02, B01) → aRemoveUndefined(Join[Zip[Mirror[{Roots[f0(a, x), y_{min}, y_{max}]}, y = x] + (a, 0), a, Sequence[x_{min} + ((x_{max} - x_{min}) / N_P * i), i, 0, N_P]]]) → P1xxyRemoveUndefined(Join[Zip[Reverse[{Roots[f0(x, a), x_{min}, x_{max}]}] + (0, a), a, Sequence[y_{min} + ((y_{max} - y_{min}) / N_P * i), i, 0, N_P]]]) → P2yyxTextfield(v_1) → inputBox2Textfield(f) → inputBox3Textfield(N_C) → inputBox1Textfield(x_{min}) → inputBox4Textfield(x_{max}) → inputBox5Textfield(y_{max}) → inputBox6Textfield(z_{max}) → inputBox7Textfield(y_{min}) → inputBox8Textfield(z_{min}) → inputBox9PointIn(poly1) → PTestPoint(a, 1 - zzii_B) → ATextfield(N_P) → inputBox10Sum(Sequence[If[f0(x(PTest), y(PTest)) - f0(x(Element[lr01, i]), y(Element[lr01, i])) > 0, 1, 0], i, 1, 11]) → ext1Zip((x(a), y(a), z0), a, Join[{P1xxy, P2yyx}]) → list1Length(list1) → LäTextfield(v) → inputBox11Textfield(step) → inputBox12Sequence(Element[list1, i], i, k, k + step) → M01Function(f(a, b), a, x_{min} - 0.2, x_{max} + 0.2, b, y_{min} - 0.2, y_{max} + 0.2) → g