
连续性与极限演示
几何画板及绘图内容加载中,请稍等……
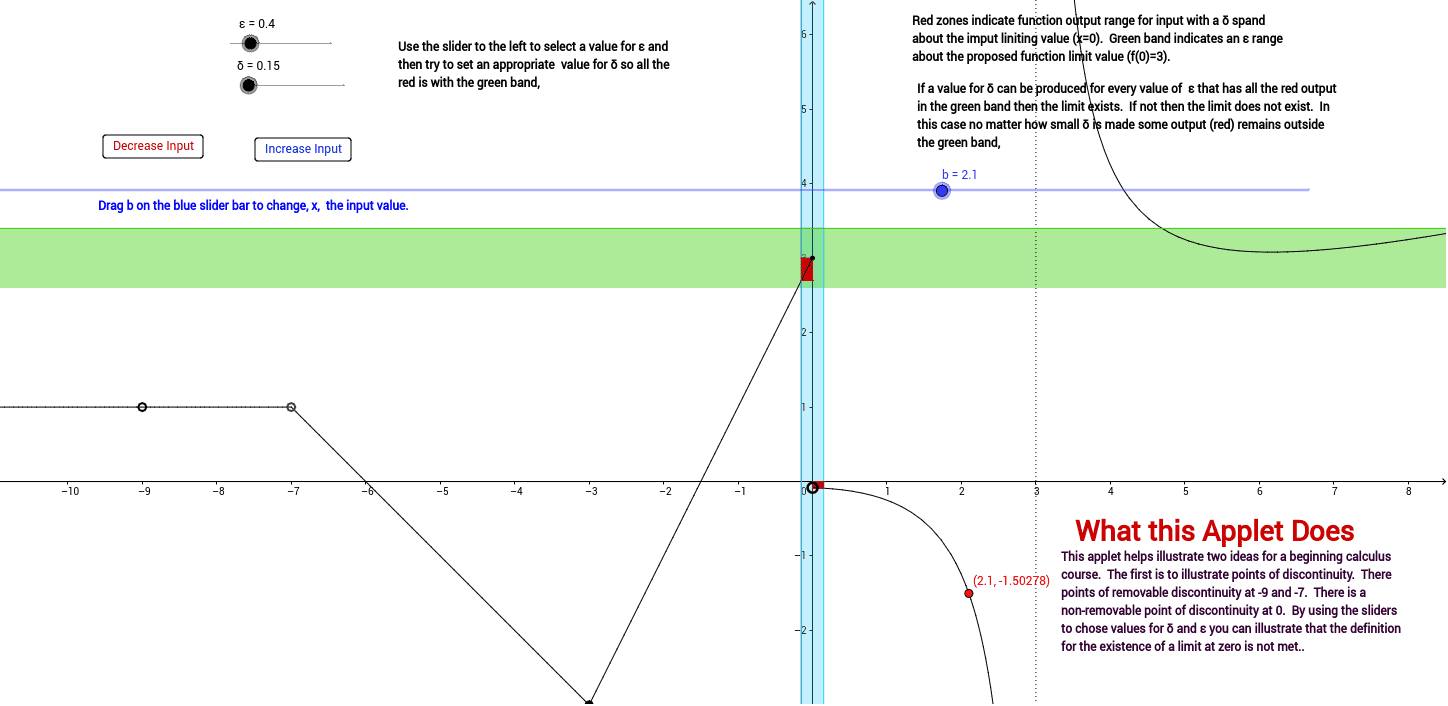
这个 GeoGebra 范例演示了初等微积分中函数的连续性与极限概念,重点展示可去间断点等不连续点的图形表现,并借助 ε-δ 语言直观阐释极限的定义。涉及的核心数学概念包括极限(Limit)、连续性(Continuity)、间断点(Discontinuity)、可去间断点(Removable discontinuity)以及 ε-δ 判准。作图要点基于构造摘要提炼:使用了 GeoGebra 命令 Function 绘制函数图像、Point 标记关键点、OrthogonalLine 作垂直线、Polygon 构建多边形区域、Intersect 求交点、Line 作直线、Text 添加文本标注;涉及对象涵盖函数 f、点 B、C、D、E、F、G、H、I、J、K、L、M、N、O、P、Q、R、S、T、U、V 以及参数 ε、δ,通过多边形与直线构造局部邻域示意图。该范例适合高中微积分入门或大学数学分析初学者,可用于课堂演示与课后自主探究。
GeoGebra 命令及参数
Function(2 * x + 3, -3, 0) → gFunction((x + 9) * (x + 7) / ((x + 9) * (x + 7)), -10000, -7) → iPoint(g) → BFunction(1 / 4 * (x^(2) + 1) * x / (x * (x - 3)), 0, 10000) → fFunction((-x - 6) * (x + 7) / (x + 7), -7, -3) → hPoint(h) → EOrthogonalLine(K, xAxis) → aOrthogonalLine(L, xAxis) → cPolygon(M, N, O, P) → poly1, m, n, o, pOrthogonalLine(Q, yAxis) → dOrthogonalLine(R, yAxis) → ePolygon(S, T, U, V) → poly2, s, t, u, vIntersect(c, m) → AIntersect(c, m) → WIntersect(c, m) → ZLine(E, B) → kIntersect(k, c) → A_1OrthogonalLine(B, yAxis) → lOrthogonalLine(A_1, yAxis) → qIntersect(yAxis, q) → B_1Intersect(l, c) → C_1Polygon(A_1, B_1, B, C_1) → poly3, a_1, b_1, b_2, c_1Intersect(a, o) → D_1Intersect(a, o) → E_1Intersect(a, o) → F_1Intersect(a, o) → G_1OrthogonalLine(K, o) → rIntersect(a, o) → H_1Intersect(a, o) → I_1Intersect(a, o) → J_1Intersect(f, a, (0.15, -0.08969298245614034)) → K_1OrthogonalLine(K_1, yAxis) → d_1Intersect(yAxis, d_1) → L_1Polygon((0, 0), L_1, K_1, K) → poly5, e_1, f_1, g_1, h_1Text("Discontinuity at x = -9.") → text3Text("Discontinuity at x = -7.") → text4Text("Discontinuity at x = 0.") → text5Text("Removable") → text6Text("Removable") → text7Text("Nonremovable") → text8Text("Drag b on the blue slider bar to change, x, the input value.") → text10Text("What this Applet Does") → text12Text("Nonremovable") → text13Text("Discontinuity at x = 0.") → text14
AI 绘图提示语参考
绘制一个用于微积分入门教学的函数图像,展示极限与连续性的ε-δ可视化。图中包含一条分段定义的曲线,在x=-9、x=-7和x=0处存在间断点,其中前两处为可去间断点,最后一处为不可去间断点。用正交直线构造局部邻域,通过交点确定边界,并用多边形高亮相关区域。在坐标轴上标注关键点,添加文字说明各间断点类型,并提示用户拖动滑块改变输入值以观察变化。
以上提示语为根据原始绘图命令整理而来,仅供参考。