
比较两个正态分布:均值与标准差的可视化
几何画板及绘图内容加载中,请稍等……
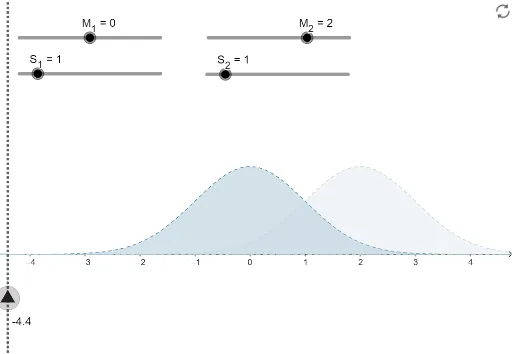
① This example dynamically visualizes how the mean and standard deviation affect the shape and position of two normal distributions, using adjustable parameters and geometric aids to highlight differences. ② Core mathematical concepts include the normal probability density function, the role of the mean in shifting the curve, the role of the standard deviation in changing spread and peak height, and comparative analysis of distributions. ③ Construction details: The Normal command generates the density curves f and g; Point objects (M_1, S_1, M_2, S_2) serve as parameter controls; OrthogonalLine and Line create perpendicular and auxiliary lines; integral-related objects (e.g., area regions) illustrate probability intervals; text1 displays key values. ④ Suitable for high school to undergraduate statistics courses, ideal for classroom demonstrations or student-led exploration of parameter effects on normal distributions.
GeoGebra 命令及参数
Normal(M_1, S_1, x, false) → fNormal(M_2, S_2, x, false) → gPoint(yAxis) → AOrthogonalLine(A, yAxis) → cPoint(c) → BLine(B, yAxis) → d