
二项分布与统计特性演示
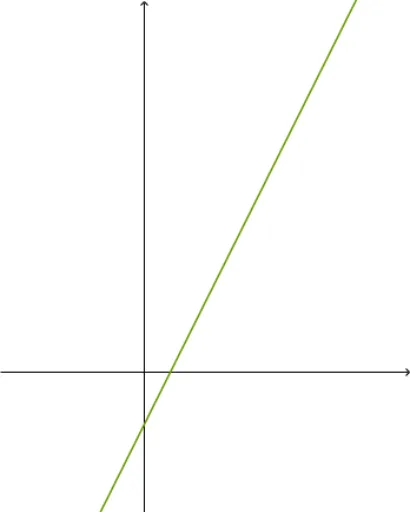
几何画板及绘图内容加载中,请稍等……
①本范例通过动态交互演示二项分布的概率特性与统计特征;②涉及核心数学概念包括二项分布、统计特性、幂函数、整数运算及几何变换;③构造中运用了Random, RandomElement, Textfield, TableText等GeoGebra命令与对象,实现随机数生成与数据展示;④适合高中及以上数学教学,用于概率统计与数据分析教学演示。
GeoGebra 命令及参数
Random(-10, 10) → aRandomElement({-5, -4, -3, -2, -1, 1, 2, 3, 4, 5}) → a_1RandomElement({-5, -4, -3, -2, -1, 1, 2, 3, 4, 5}) → cRandom(-10, 10) → bTextfield(h) → InputBox1Random(-10, 10) → b_1RandomElement({-5, -4, -3, -2, -1, 1, 2, 3, 4, 5}) → c_1Random(-10, 10) → d_1Textfield(m) → InputBox2Textfield(f) → InputBox4Random(-10, 10) → d_2TableText({{A1_1, B_1, C_1, D_1}, {-3, g(-3), h(-3), f(-3)}, {-2, g(-2), h(-2), f(-2)}, {-1, g(-1), h(-1), f(-1)}, {0, g(0), h(0), f(0)}, {1, g(1), h(1), f(1)}, {2, g(2), h(2), f(2)}, {3, g(3), h(3), f(3)}, {m, e, l, k}}, "|_r") → text3_1