
Z-test of a Mean by GeoGebra Team
Loading the math board and drawing, please wait…
In collections
Learn GeoGebra Classic
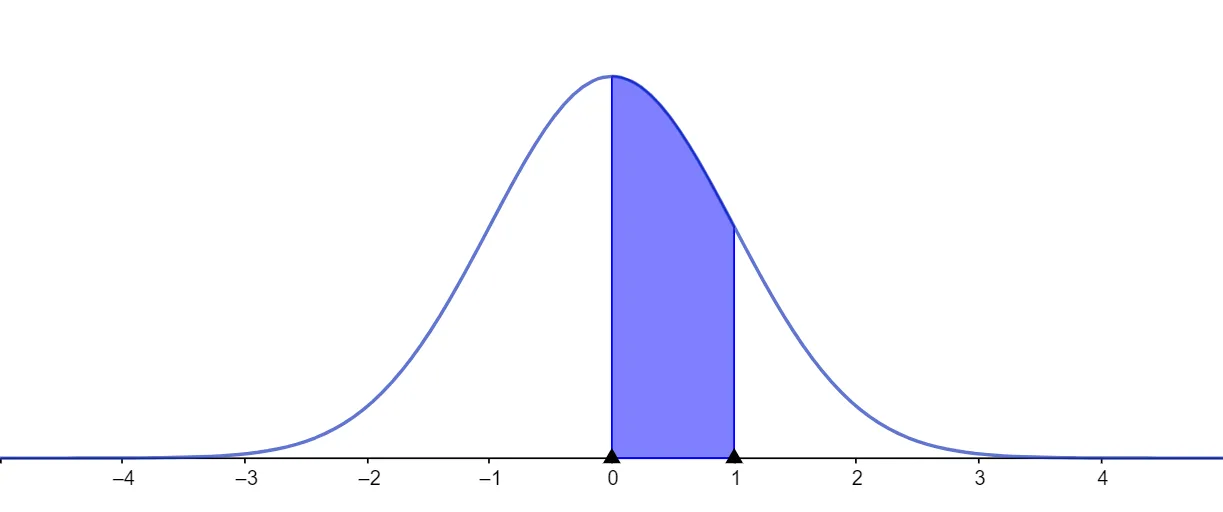
①This example demonstrates how to perform a Z-test for a population mean, allowing users to input sample mean, population standard deviation, sample size, and significance level to visualize the test statistic, critical values, and p-value, and decide whether to reject the null hypothesis. ②Core mathematical concepts include hypothesis testing, standard normal distribution, Z-statistic, significance level, critical region, and p-value. ③Construction notes: Although no specific GeoGebra commands are provided in the abstract, typical construction involves using sliders to adjust parameters, input boxes for data entry, plotting the standard normal density curve (function), marking critical values (points), and shading the rejection region (integral or polygon). ④Suitable for high school or college statistics courses, this interactive tool helps students understand the steps and interpretation of Z-tests, and can be used for classroom demonstrations or self-directed exploration.
AI Drawing Prompt Reference
Create a Z-test graph with input boxes for sample mean, population standard deviation, sample size, and significance level, a standard normal distribution curve, two lines indicating critical values, and a shaded region for the rejection area. Start by creating input boxes to adjust parameters, then plot the standard normal distribution curve, mark the critical values next, and finally determine and fill the rejection area based on the significance level.
The prompt above was compiled from the original drawing commands and is for reference only.