
y=mx+b
Loading the math board and drawing, please wait…
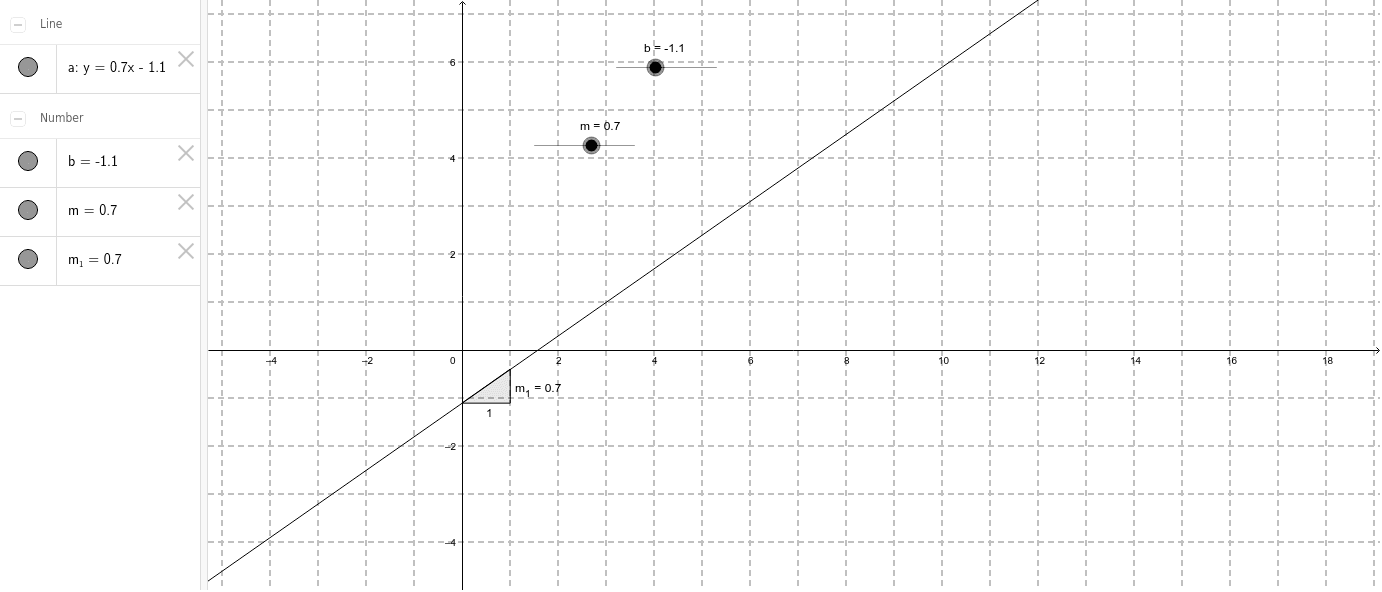
This example explores the linear equation y=mx+b using sliders. It demonstrates how the slope m and y-intercept b affect the position of the line. The Slope command is used to dynamically show changes in slope. Suitable for middle school and above students to learn about linear equations and geometric transformations.
GeoGebra Commands & Parameters
Slope(a) → m_1
AI Drawing Prompt Reference
Draw a line with the equation y=mx+b. Use sliders to adjust the slope m and y-intercept b, and observe how the line's position changes. First, draw the x-axis and y-axis, then use the slider m to dynamically show changes in slope, and finally use the slider b to adjust the line's position on the y-axis.
The prompt above was compiled from the original drawing commands and is for reference only.