
Wingspan Scatter Plot with Equilateral Triangles
Loading the math board and drawing, please wait…
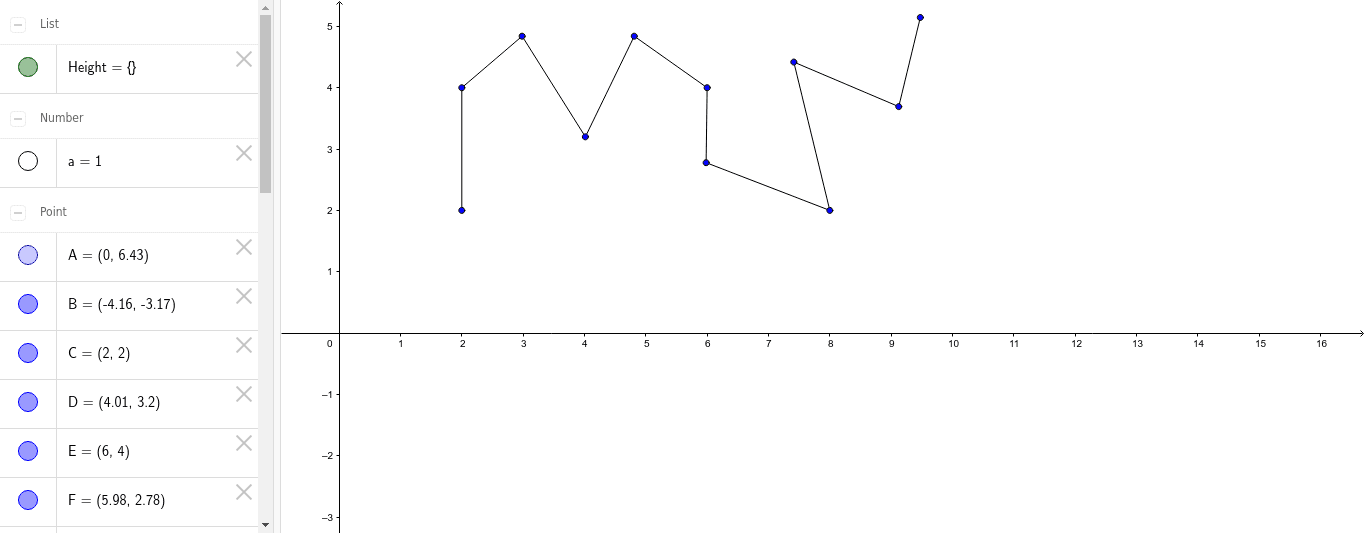
① This GeoGebra example presents a scatter plot titled 'Wingspan Scatter Plot' that incorporates equilateral triangles, a general quadrilateral, and piecewise/step functions, visually linking data points with geometric figures. ② Core mathematical concepts include scatter plot data visualization, equilateral triangle properties, derivatives (for analyzing rates of change), general quadrilateral construction, and graphing piecewise and step functions. ③ Construction highlights: from the summary, Point and Segment commands are used to create points (A1, A, B, C, etc.) and segments (a, b, c, etc.), with a Height object for auxiliary measurements, combining these primitives to form the scatter plot and geometric shapes. ④ Suitable for high school to early college students in math labs or exploratory activities, it helps understand the interplay between data distribution and geometric construction.
GeoGebra Commands & Parameters
Point(yAxis) → ASegment(C, G) → bSegment(G, H) → cSegment(H, D) → dSegment(D, I) → eSegment(I, E) → fSegment(E, F) → gSegment(F, J) → hSegment(J, K) → iSegment(K, L) → jSegment(L, M) → k
AI Drawing Prompt Reference
Draw a scatter plot titled “Wingspan Scatter Plot” showing data points, then construct equilateral triangles on selected points, a general quadrilateral, and piecewise or step function curves; connect the points sequentially with line segments to form the geometric figures, and include auxiliary height lines for measurement reference, using a series of segments linking successive points to outline the shapes, and add a height segment from a vertex to the opposite side as an auxiliary measurement.
The prompt above was compiled from the original drawing commands and is for reference only.