
Who Should You Root For? Exploring Secant Lines, Ratios, and Rational Numbers on
Loading the math board and drawing, please wait…
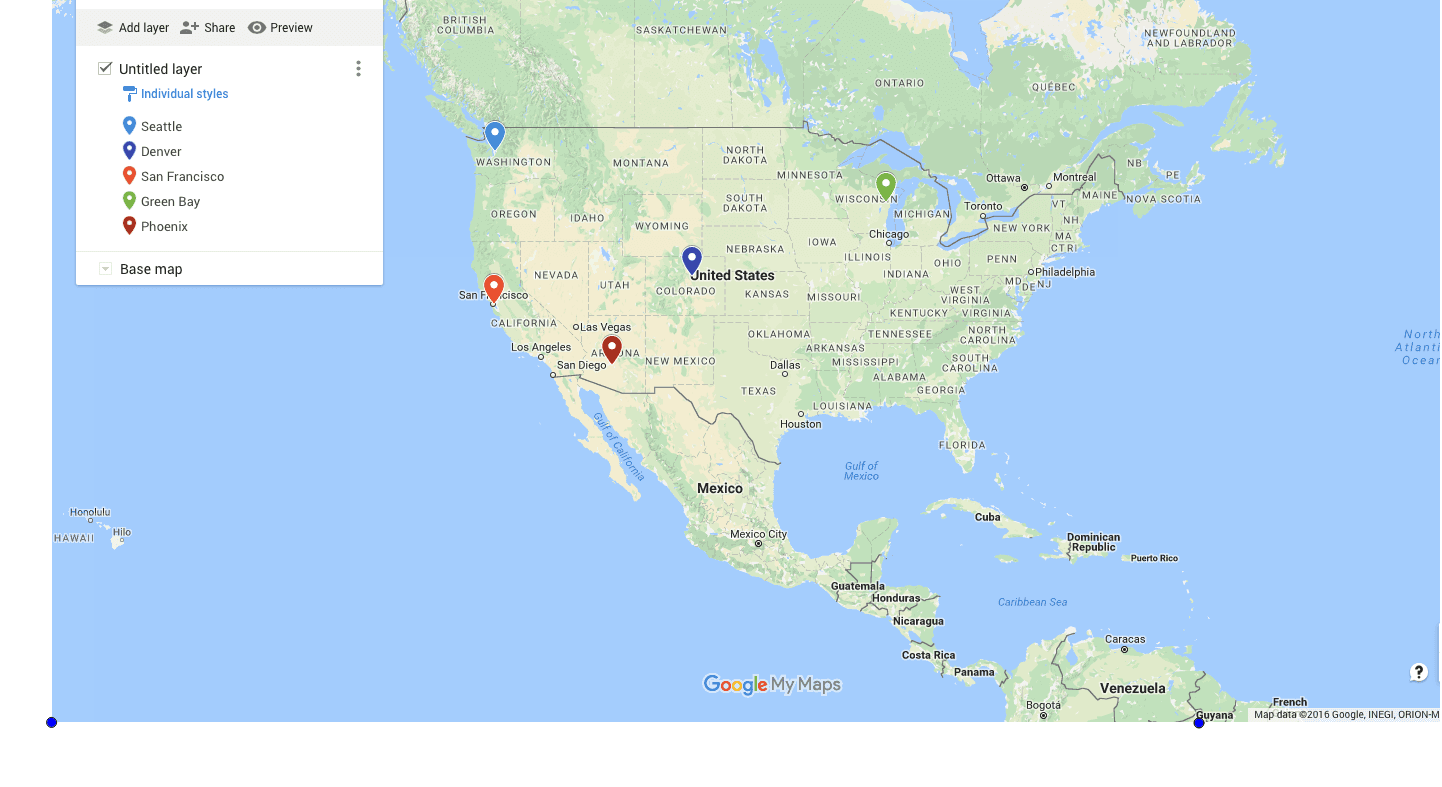
① This interactive GeoGebra example presents a playful question—'Who should you root for?'—while visually demonstrating how secant lines on a function graph compare rates of change between two points. ② Core mathematical concepts include secant line slope, function graphs, ratios, rational numbers, and LCM/GCD, all integrated into a single exploratory scene. ③ Construction details: based on the summary, the example uses point objects A and B, along with an image object pic1, to set up two key points and draw a secant line, likely with dynamic adjustments (e.g., sliders) to observe how the slope changes as points move. ④ This is suitable for middle-to-high school students (grades 8–12) to deepen understanding of rates of change, proportional reasoning, and rational number operations, and can serve as an engaging introduction to mathematical modeling or a fun classroom activity.
GeoGebra Commands & Parameters
Point A(-3.268, -8.148)Point B(19.68, -8.16)