
What is a Cobweb Diagram?
Loading the math board and drawing, please wait…
In collections
ATC Cobwebs and Linear Difference Equations
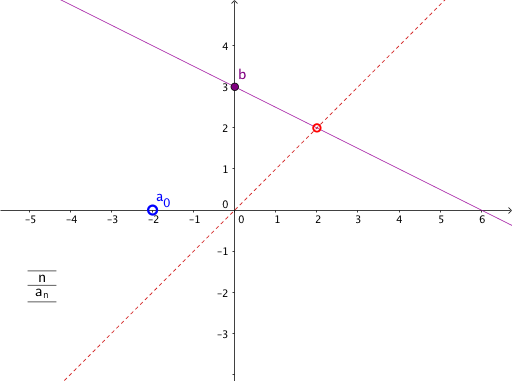
This example illustrates the concept of a Cobweb Diagram, a graphical tool used to analyze the behavior of function iterations. It connects function values with input values in a coordinate system to visually demonstrate the function's iterative process. The example uses basic objects like functions, points, and line segments, and constructs the Cobweb Diagram through commands such as Point, Segment, and Intersect. Suitable for high school mathematics education, particularly in the study of function iterations and dynamic geometry.
GeoGebra Commands & Parameters
Point(yAxis) → CPoint(xAxis) → ASegment(A, (x(A), f(x(A)))) → cSegment((A1, A2), (A2, A2)) → B1Segment((A2, A2), (A2, A3)) → C1Segment((A2, A3), (A3, A3)) → B2Segment((A3, A3), (A3, A4)) → C2Segment((A3, A4), (A4, A4)) → B3Segment((A4, A4), (A4, A5)) → C3Segment((A4, A5), (A5, A5)) → B4Segment((A5, A5), (A5, A6)) → C4Segment((A5, A6), (A6, A6)) → B5Segment((A6, A6), (A6, A7)) → C5Segment((A6, A7), (A7, A7)) → B6Segment((A7, A7), (A7, A8)) → C6Segment((A7, A8), (A8, A8)) → B7Segment((A8, A8), (A8, A9)) → C7Segment((A8, A9), (A9, A9)) → B8Segment((A9, A9), (A9, A10)) → C8Segment((A9, A10), (A10, A10)) → B9Segment((A10, A10), (A10, A11)) → C9Segment((A10, A11), (A11, A11)) → B10Segment((A11, A11), (A11, A12)) → C10Segment((A11, A12), (A12, A12)) → B11Segment((A12, A12), (A12, A13)) → C11Segment((A12, A13), (A13, A13)) → B12Segment((A13, A13), (A13, A14)) → C12Segment((A13, A14), (A14, A14)) → B13Segment((A14, A14), (A14, A15)) → C13Segment((A14, A15), (A15, A15)) → B14Segment((A15, A15), (A15, A16)) → C14Segment((A15, A16), (A16, A16)) → B15Segment((A16, A16), (A16, A17)) → C15Segment((A16, A17), (A17, A17)) → B16Segment((A17, A17), (A17, A18)) → C16Segment((A17, A18), (A18, A18)) → B17Segment((A18, A18), (A18, A19)) → C17Segment((A18, A19), (A19, A19)) → B18Segment((A19, A19), (A19, A20)) → C18Segment((A19, A20), (A20, A20)) → B19Segment((A20, A20), (A20, A21)) → C19Segment((A20, A21), (A21, A21)) → B20Segment((A21, A21), (A21, A22)) → C20Segment((A21, A22), (A22, A22)) → B21Segment((A22, A22), (A22, A23)) → C21Segment((A22, A23), (A23, A23)) → B22Segment((A23, A23), (A23, A24)) → C22Segment((A23, A24), (A24, A24)) → B23Segment((A24, A24), (A24, A25)) → C23Segment((A24, A25), (A25, A25)) → B24Segment((A25, A25), (A25, A26)) → C24Segment((A25, A26), (A26, A26)) → B25Segment((A26, A26), (A26, A27)) → C25Segment((A26, A27), (A27, A27)) → B26Segment((A27, A27), (A27, A28)) → C26Segment((A27, A28), (A28, A28)) → B27Segment((A28, A28), (A28, A29)) → C27Segment((A28, A29), (A29, A29)) → B28Segment((A29, A29), (A29, A30)) → C28Segment((A29, A30), (A30, A30)) → B29Segment((A30, A30), (A30, A31)) → C29Segment((A30, A31), (A31, A31)) → B30Segment((A31, A31), (A31, A32)) → C30Segment((A31, A32), (A32, A32)) → B31Segment((A32, A32), (A32, A33)) → C31Segment((A32, A33), (A33, A33)) → B32Segment((A33, A33), (A33, A34)) → C32Segment((A33, A34), (A34, A34)) → B33Segment((A34, A34), (A34, A35)) → C33Segment((A34, A35), (A35, A35)) → B34Segment((A35, A35), (A35, A36)) → C34Segment((A35, A36), (A36, A36)) → B35Segment((A36, A36), (A36, A37)) → C35Segment((A36, A37), (A37, A37)) → B36Segment((A37, A37), (A37, A38)) → C36Segment((A37, A38), (A38, A38)) → B37Segment((A38, A38), (A38, A39)) → C37Segment((A38, A39), (A39, A39)) → B38Segment((A39, A39), (A39, A40)) → C38Intersect(f, b) → BIf(steps < 0, {}, Take[list1, 1, steps / 2 + 1]) → list2Sequence(a, a, 0, floor(steps / 2)) → list3TableText({Join[{{"n"}, list3}], Join[{{"a_n"}, list2}]}, "c_h") → text9
AI Drawing Prompt Reference
Draw a cobweb diagram in a coordinate system to illustrate the iterative process of a function. Start by marking points on the x-axis and y-axis. Then connect each x-axis point to the corresponding point on the function's graph, and draw a vertical line from that point back to the x-axis, forming a zigzag pattern. Repeat this process to create multiple zigzag lines, visually demonstrating the function's iteration behavior.
The prompt above was compiled from the original drawing commands and is for reference only.