
What Can a Parabola Tell Us?
Loading the math board and drawing, please wait…
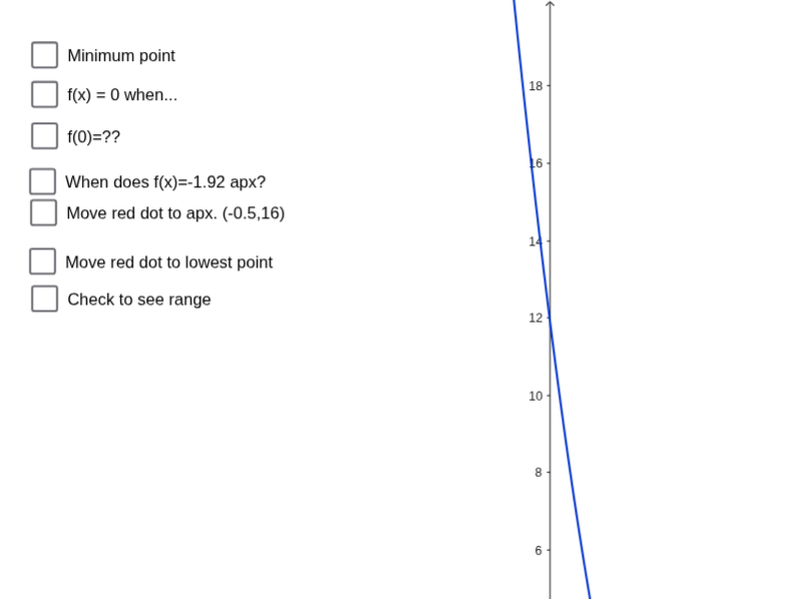
This example demonstrates the geometric properties and relationship between parabola and function graphs. It involves core math concepts: function graph, parabola, difference and slope, derivative, geometric transformations, root, hypergeometric distribution. Construction highlights include using GeoGebra commands like Point and Intersect. Suitable for high school students and math enthusiasts learning function and derivative applications.
GeoGebra Commands & Parameters
Point(f) → A_1Point(f) → AIntersect(f, xAxis, 1) → BIntersect(f, xAxis, 2) → CIntersect(f, yAxis, 1) → DPoint(f) → EPoint(f) → FPoint(f) → GPoint(f) → H
AI Drawing Prompt Reference
Draw a function graph and mark several points on it, including one on the x-axis and one on the y-axis, with a few more on the function curve. Also, plot the x-axis and y-axis, and label the two intersection points of the function with the x-axis. Use these points and axes to demonstrate the geometric properties and derivative relationships of the function, as well as transformations and the concept of roots.
The prompt above was compiled from the original drawing commands and is for reference only.