
Way 1 of Original Data: Geometric Segment Diagnosis of Non-constant Variance
Loading the math board and drawing, please wait…
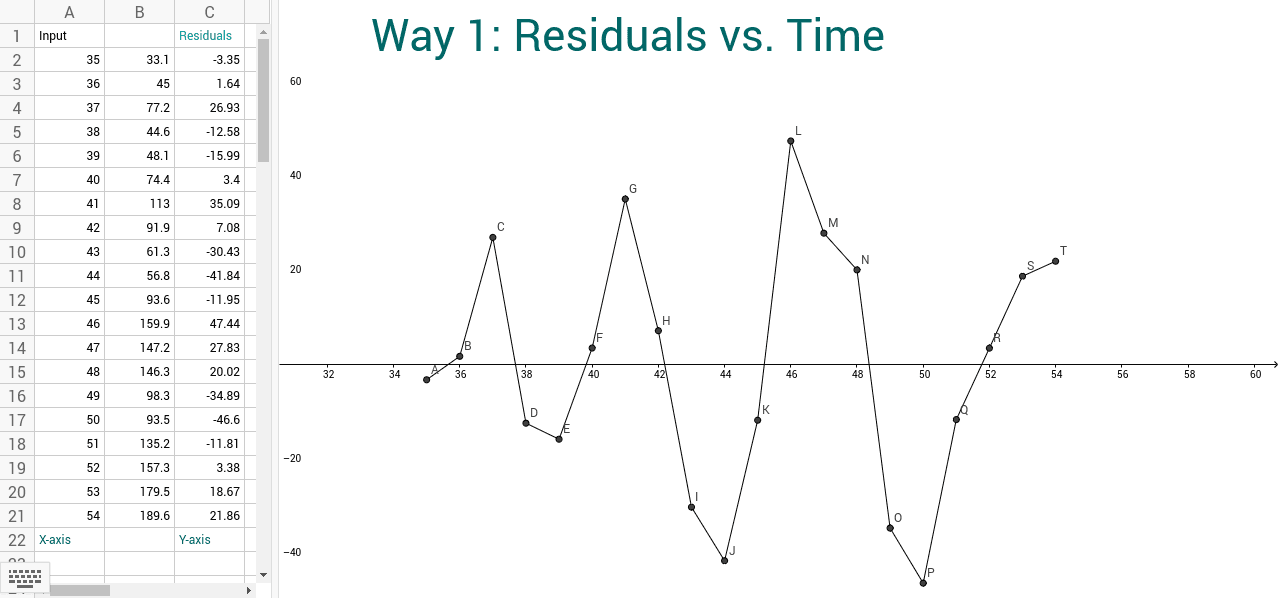
This interactive GeoGebra applet demonstrates a geometric approach to diagnosing non-constant variance (heteroscedasticity) within a dataset, utilizing the 'Way 1 of Original Data' methodology. The core mathematical concepts include statistical variance, regression diagnostics, and the geometric representation of data variability through spatial segment lengths. To construct this visual model, the applet utilizes the GeoGebra `Segment` command to map relationships across a series of coordinate points, specifically generating a structured network of segments anchored by objects C1 through C14, and controlled by point sets like A2, B2, C2 up to A14, B14, C14. By observing the changing lengths and orientations of these segments, users can visually identify variance instability. This tool is highly suitable for university students majoring in statistics, researchers performing regression analysis, and high school mathematics teachers explaining the geometric intuition behind statistical heteroscedasticity.
GeoGebra Commands & Parameters
Segment(A, B) → aSegment(B, C) → bSegment(C, D) → cSegment(D, E) → dSegment(E, F) → eSegment(F, G) → gSegment(G, H) → hSegment(H, I) → iSegment(I, J) → jSegment(J, K) → kSegment(K, L) → lSegment(L, M) → mSegment(M, N) → nSegment(N, O) → pSegment(O, P) → qSegment(P, Q) → rSegment(Q, R) → sSegment(R, S) → tSegment(S, T) → a_1